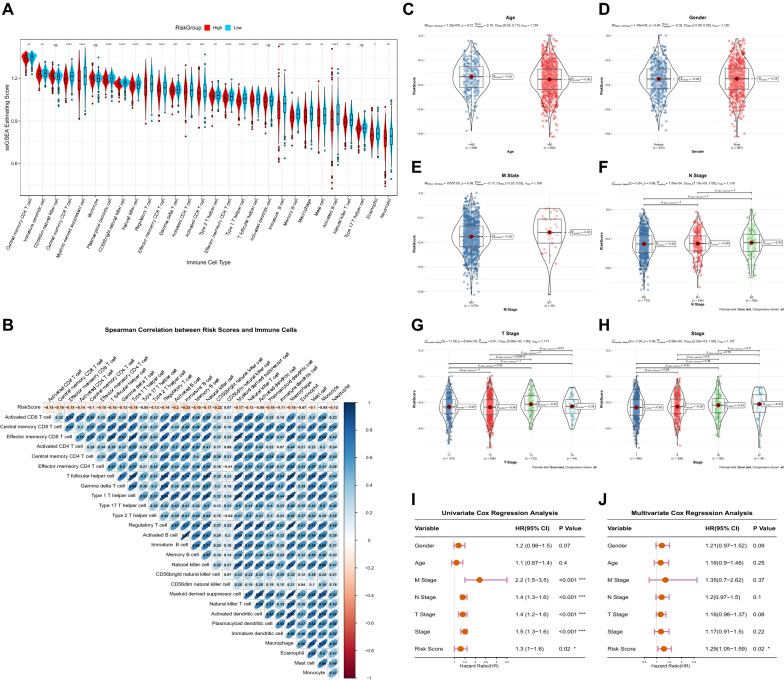
Fig. 5.
Immune predictive performance and clinical predictive power of the prognostic model. A After grouping the risk score according to the median, check the abundance of 28 immune cells in the high-risk and low-risk groups. B Spearman correlation analysis between risk score and the abundance of 28 kinds of immune cells. C–H Age, Gender, M stage, N stage, T stage, and Stage distribution of the patients in the high-risk and low-risk groups. Univariate Cox Regression (I) and Multivariate Cox Regression (J) analysis of clinical information of TCGA cohorts. (*P < 0.05; **P < 0.01; ***P < 0.001; ****P < 0.0001)

