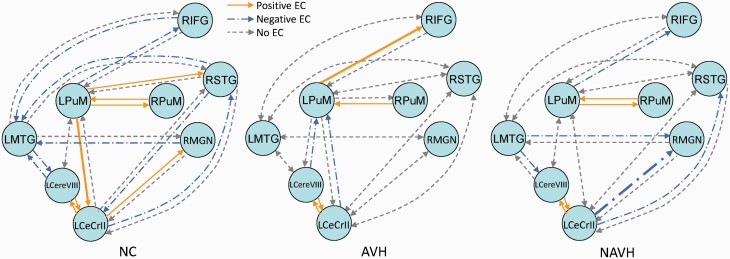
Fig. 3.
The DCM model at the group level. The solid and long-dash dotted lines represent significant nonzero values revealed from single-group analysis. The solid lines represent significant positive effective connectivity, and the long-dash dotted lines represent significant negative effective connectivity. The dash lines indicate that the connectivity value was not a significant nonzero value. The bold lines indicate significant differences between groups. AVH, auditory verbal hallucination; DCM, dynamic causal modeling; LCereVIII, left cerebellum VIII; LCeCrII, left cerebellum crus II; LMTG, left middle temporal gyrus; LPuM, left medial pulvinar; NAVH, without auditory verbal hallucination; NC, normal control; RIFG, right inferior frontal gyrus; RMGN, right medial geniculate nucleus; RPuM, right medial pulvinar; RSTG, right superior temporal gyrus.

