
FIGURE 3.
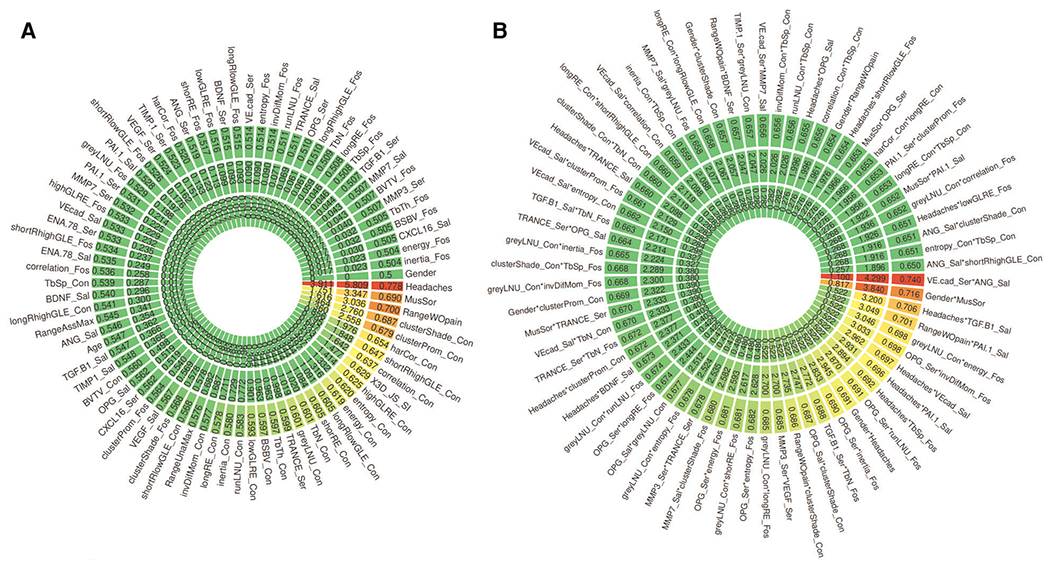
General association analysis of risk factors for 79 features (A) and 66 top interactions (B). (A,B) The outer circle shows the AUC, middle circle shows the p-values, and the inner circle shows the q-values for each single feature.
Official websites use .gov
A
.gov website belongs to an official
government organization in the United States.
Secure .gov websites use HTTPS
A lock (
) or https:// means you've safely
connected to the .gov website. Share sensitive
information only on official, secure websites.
General association analysis of risk factors for 79 features (A) and 66 top interactions (B). (A,B) The outer circle shows the AUC, middle circle shows the p-values, and the inner circle shows the q-values for each single feature.