
FIGURE 4.
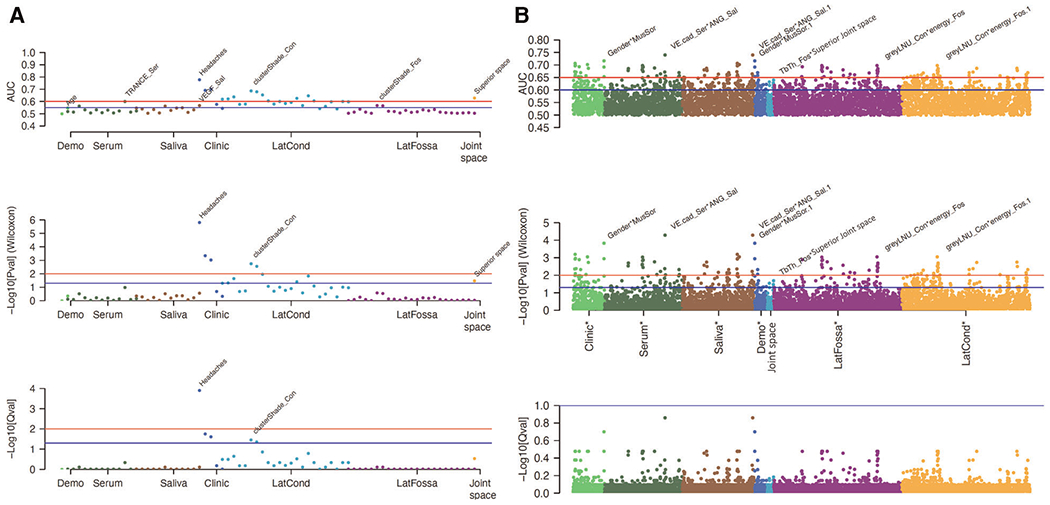
Graphic displays of 79 features (A) and 3,081 interactions (B). (A,B) The upper graphic shows the AUC, the middle graph shows the p-values, and the lower category shows the q-values for each category of features.
Official websites use .gov
A
.gov website belongs to an official
government organization in the United States.
Secure .gov websites use HTTPS
A lock (
) or https:// means you've safely
connected to the .gov website. Share sensitive
information only on official, secure websites.
Graphic displays of 79 features (A) and 3,081 interactions (B). (A,B) The upper graphic shows the AUC, the middle graph shows the p-values, and the lower category shows the q-values for each category of features.