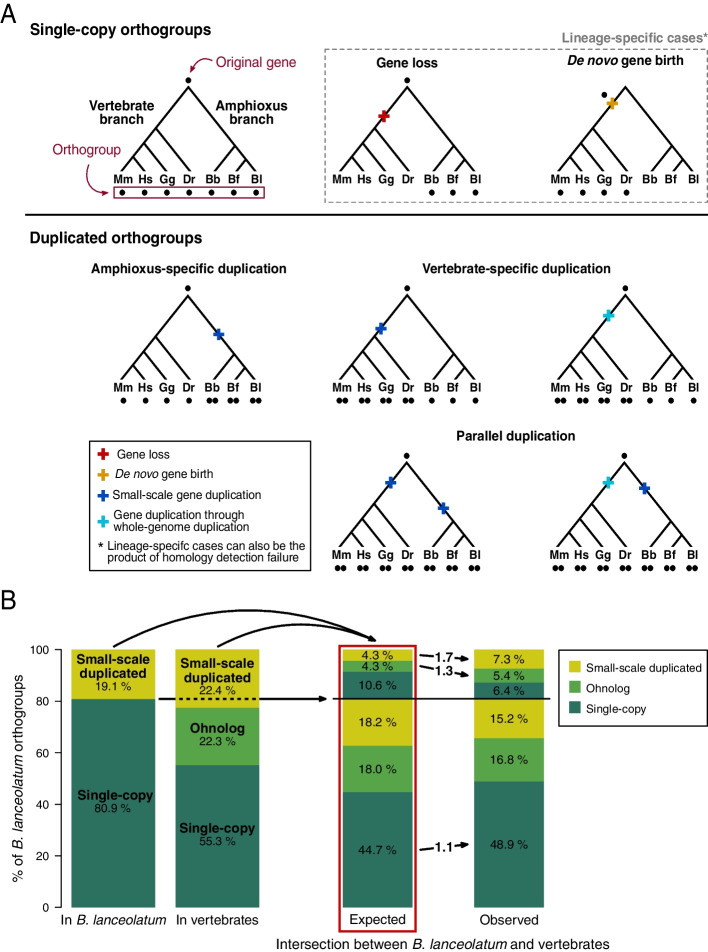
Fig. 2.
Single-copy and duplicated orthogroups in the amphioxus and vertebrate lineages. A Schematic representation of the chordate gene orthogroup classification, showing examples of different gene evolutionary histories represented as gene trees. Each point represents a gene; all gene trees are derived from a single original gene, and all genes at the tips of a tree are grouped into an orthogroup. Orthogroups are classified as duplicated or single-copy depending on whether there was a duplication in their evolutionary history or not. Duplicated orthogroups can originate from amphioxus-specific, vertebrate-specific, or parallel duplications. In addition, gene duplications in the vertebrate lineage can be the product of either a small-scale duplication or a whole genome duplication (ohnologs; see the “Methods” section). All duplications in the amphioxus lineage are small-scale. Duplications predating the last common ancestor of chordates are separated in different orthogroups and, thus, not taken into account as duplications in our study (see the “Methods” section). Events of gene loss, de novo gene birth, or homology detection failure are also considered. These events can result in lineage-specific orthogroups and can appear in any branch of the tree and in combination with duplication events. Each orthogroup gene evolutionary history is reconstructed based on the number and distribution of its genes across vertebrate and amphioxus species. Mm, Hs, Gg, Dr, Bb, Bf, and Bl correspond to mouse (M. musculus), human (H. sapiens), chicken (G. gallus), zebrafish (D. rerio), and B. belcheri, B. floridae, and the European amphioxus (B. lanceolatum), respectively. B Enrichment in parallel duplications in the amphioxus and the vertebrate lineages. Only B. lanceolatum orthogroups which have vertebrate orthologs are represented. The 1st column on the left shows the percentage of B. lanceolatum orthogroups that are either single-copy or small-scale duplicated. The 2nd column shows the percentage of B. lanceolatum orthogroups that are either single-copy, ohnolog, or small-scale duplicated in vertebrates. The 3rd and 4th columns show, respectively, the expected (if independently distributed) and the observed intersections between the sets of orthogroups depicted in columns 1 and 2. In the 3rd and the 4th columns, orthogroups below the horizontal line correspond to orthogroups that are single-copy in B. lanceolatum while orthogroups above the horizontal line correspond to orthogroups duplicated in B. lanceolatum. Categories that are enriched in the observed values, compared to the expected, are depicted with arrows between the 3rd and the 4th columns. Numbers on those arrows correspond to the binary logarithm of the ratio between observed and expected values (log2 fold change), all of which have p-value ≤ 0.0002 after Bonferroni multiple testing correction (corresponding values are in Table S1). For example, 4.3% of the B. lanceolatum small-scale duplicated orthogroups are expected to be small-scale duplicated in vertebrates (top light green set in the 3rd column) while 7.3% is observed (top light green set in the 4th column). This represents a 1.7 log2 fold change enrichment

