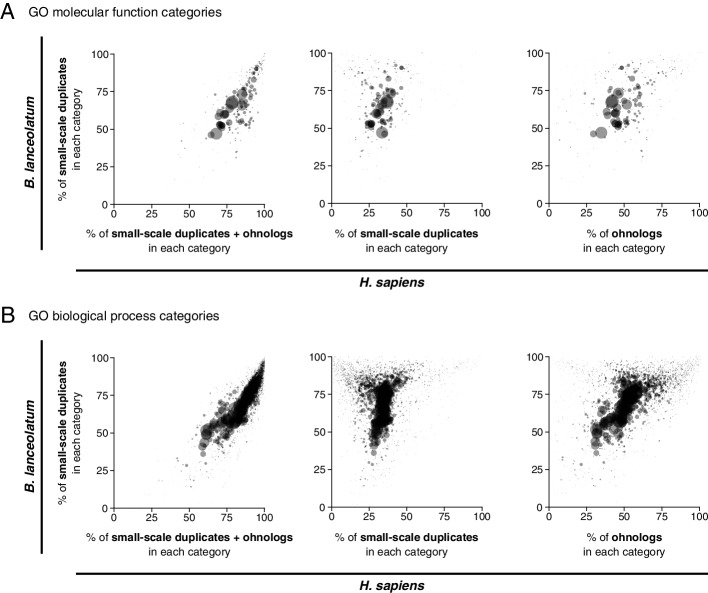
Fig. 3.
Parallelism between amphioxus and human in the amount of gene duplicates across Gene Ontology (GO) terms. Each point in each plot represents a GO term, where point size is proportional to the number of H. sapiens genes in the corresponding GO term. The percentage of the total number of genes annotated to each GO term which are small-scale duplicates in B. lanceolatum (y-axis in all plots) is compared with the percentage of the total number of genes annotated to the same GO term that are duplicated in H. sapiens (x-axis), including both small-scale duplicates and ohnologs, (left); only small-scale duplicates (center); and only ohnologs (right). Molecular function GO terms are represented in A and biological process GO terms in B. For example, 35.5% of the 1551 human genes annotated to the biological process GO term “cell cycle” (GO:0007049) are duplicated by small-scale duplication, while 56.1% of the 1077 amphioxus genes annotated to the same term are duplicated; thus, this term is represented at the coordinated (56.1, 35.5) in the graph in the middle of B. B. lanceolatum GO term annotation was extrapolated from the human GO term annotation, and only H. sapiens–B. lanceolatum orthologous genes were considered in this analysis (see the “Methods” section). Only GO terms with a minimum of 50 genes in both human and B. lanceolatum were considered. No statistical test for correlation was performed since GO terms are not independent of each other. All points are filled with the same semi-transparent black color, thus opaque regions imply a high point density

