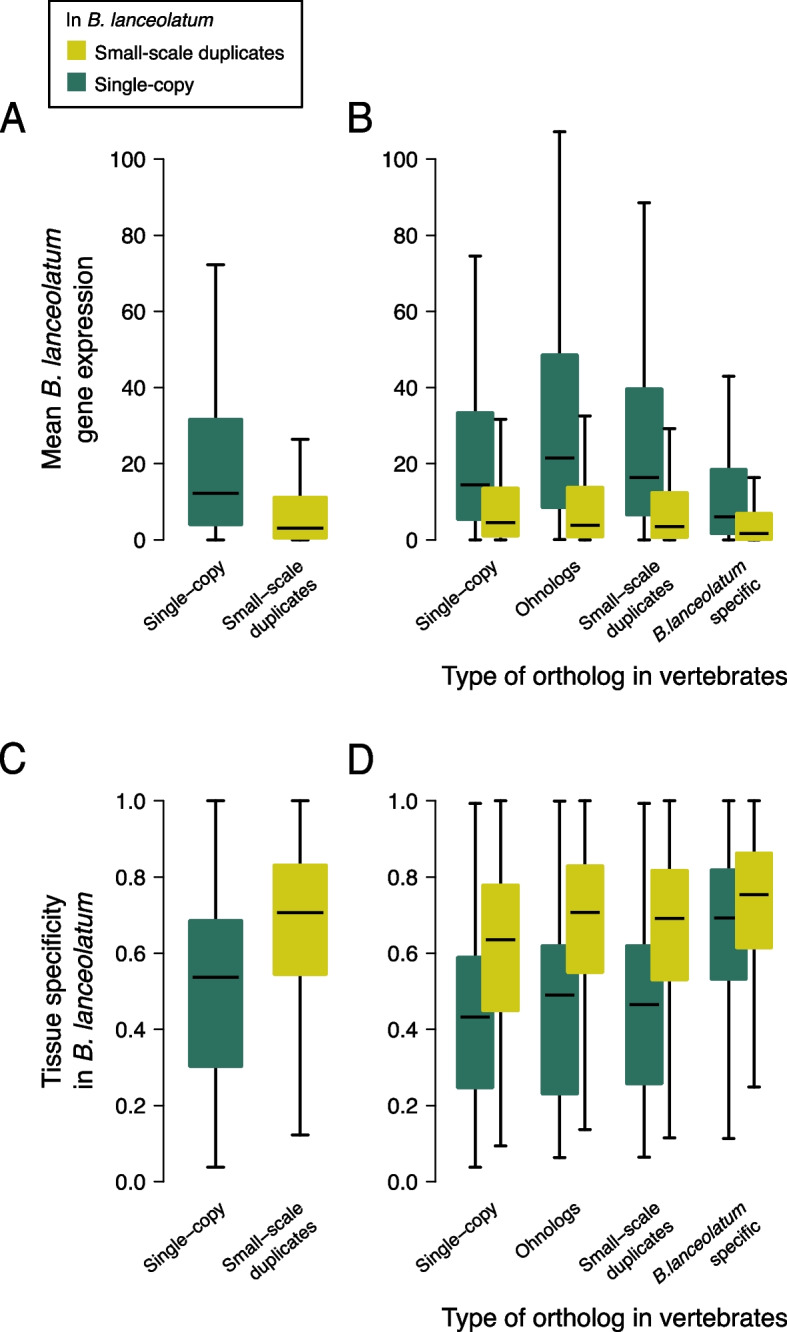
Fig. 4.

Gene expression in single-copy and duplicated genes in B. lanceolatum. A Box plots showing the distribution of mean gene expression (in transcripts per million; TPM) across adult amphioxus tissues for B. lanceolatum single-copy and small-scale duplicated genes. Outliers are not represented (see the “Methods” section). B Same as in A but dividing B. lanceolatum genes according to the status of their vertebrate ortholog if present (single-copy, ohnolog, small-scale duplicate, or no ortholog [B. lanceolatum specific]). C, D Box plots showing tissue specificity distribution of B. lanceolatum gene expression (Tau statistic) for the same gene groups as A and B, respectively. Tau values range from 0 (ubiquitous expression) to 1 (expression only in 1 tissue). Similar results across developmental stages are shown in Figure S3
