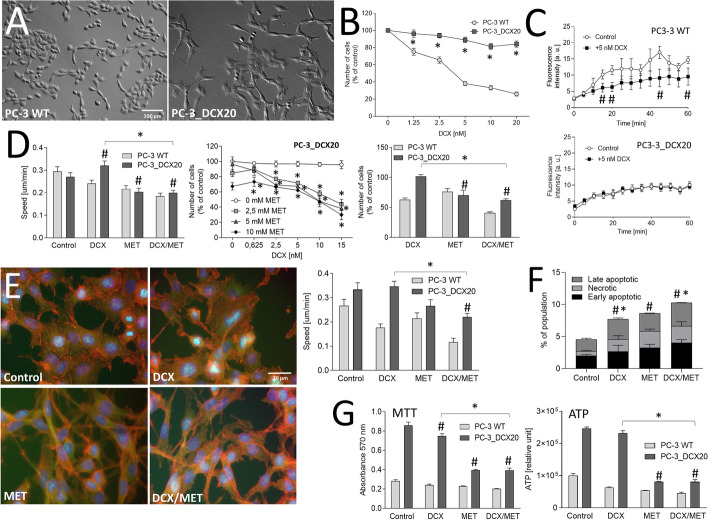
Fig. 2.
Drug resistance attenuates the reactivity of prostate cancer cells to the combined DCX/MET stress. A Morphology of PC-3_DCX20 cells. B DCX resistance of PC-3_DCX20 cells estimated with proliferation assay in the presence of DCX (0.25–20 nM). C Drug-efflux efficiency in 10 nM DCX-exposed PC-3 WT and PC-3_DCX20 populations, estimated with the calcein efflux assay. D Motility (left) and proliferation (middle/right) of PC-3 WT and PC-3_DCX20 cells in the presence of DCX and/or MET estimated with time-lapse videomicroscopy (immediately after 2.5 nM DCX/10 mM MET administration) and Coulter counter (48 h thereafter). E Intracellular localization of actin (red), vinculin (green) and DNA (blue) [left panel] and motility (right panel) of DCX/MET (2.5 nM/10 mM) treated PC-3_DCX20 cells 48 h after DCX/MET administration. F, G Apoptotic response of PC-3_DCX20 cells (estimated with annexinV/PI assay, F) and their viability [estimated with MTT (G, left) and intracellular ATP assays (G, right)] after 48-h-long DCX/MET (2.5 nM/10 mM) treatment. The statistical significance of the differences was tested for PC-3_DCX20 cells with the Student’s t-test (in B, C, proliferation in D, F, G), or by one-way ANOVA followed by post hoc Tukey’s HSD (motility in D, E). #P ≤ 0.05 versus untreated control; *P ≤ 0.05 as indicated in the charts or 0 mM MET (D, middle graph) or PC-3 WT (F). All results are representative of at least three independent experiments (N ≥ 3). Error bars represent SEM. Note negligible PC-3_DCX20 reactions to the combined DCX/MET treatment

