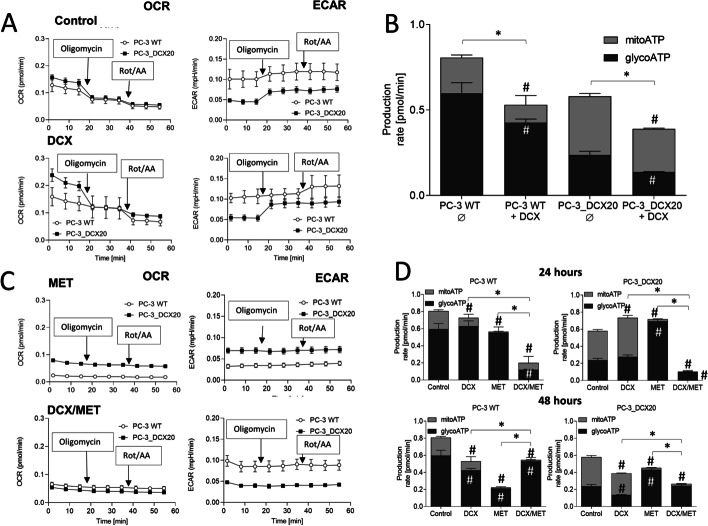
Fig. 4.
MET induces Warburg effect in prostate cancer cells. A OCR/ECAR of control and DCX-treated (48 h) PC-3 WT cells and their PC-3_DCX20 counterparts were analyzed with the Seahorse Analyzer XF HS Mini and XFp software, using the Real-Time ATP Rate Assay [arrows show the timepoints of oligomycin (1 μM) and rotenone/antimycin A application (1 μM/0.5 μM, respectively)]. B DCX-induced metabolic microevolution of PC-3 cells visualized by the differences in the metabolic profile (mitoATP versus glycoATP) of PC-3 WT and PC-3_DCX20 cells in the presence/absence of 2.5 nM DCX. C OCR/ECAR of MET or DCX/MET-treated (48 h) PC-3 WT and PC-3_DCX20 cells analyzed as in A. D The effect of MET on the metabolic profile of PC-3 WT and PC-3_DCX20 cells cultivated in the presence/absence of DCX. All the values are calculated per 105 cells. The statistical significance of the differences was tested with Student’s t-test; #P ≤ 0.05 versus a relevant control; *P ≤ 0.05 versus indicated values counted as the sum of mitoATP and glycoATP. All results are representative of at least three independent experiments (N ≥ 3). Error bars represent SEM. Note the inhibition of OXPHOS in DCX/MET-treated PC-3_DCX20 cells

