
Fig. 7.
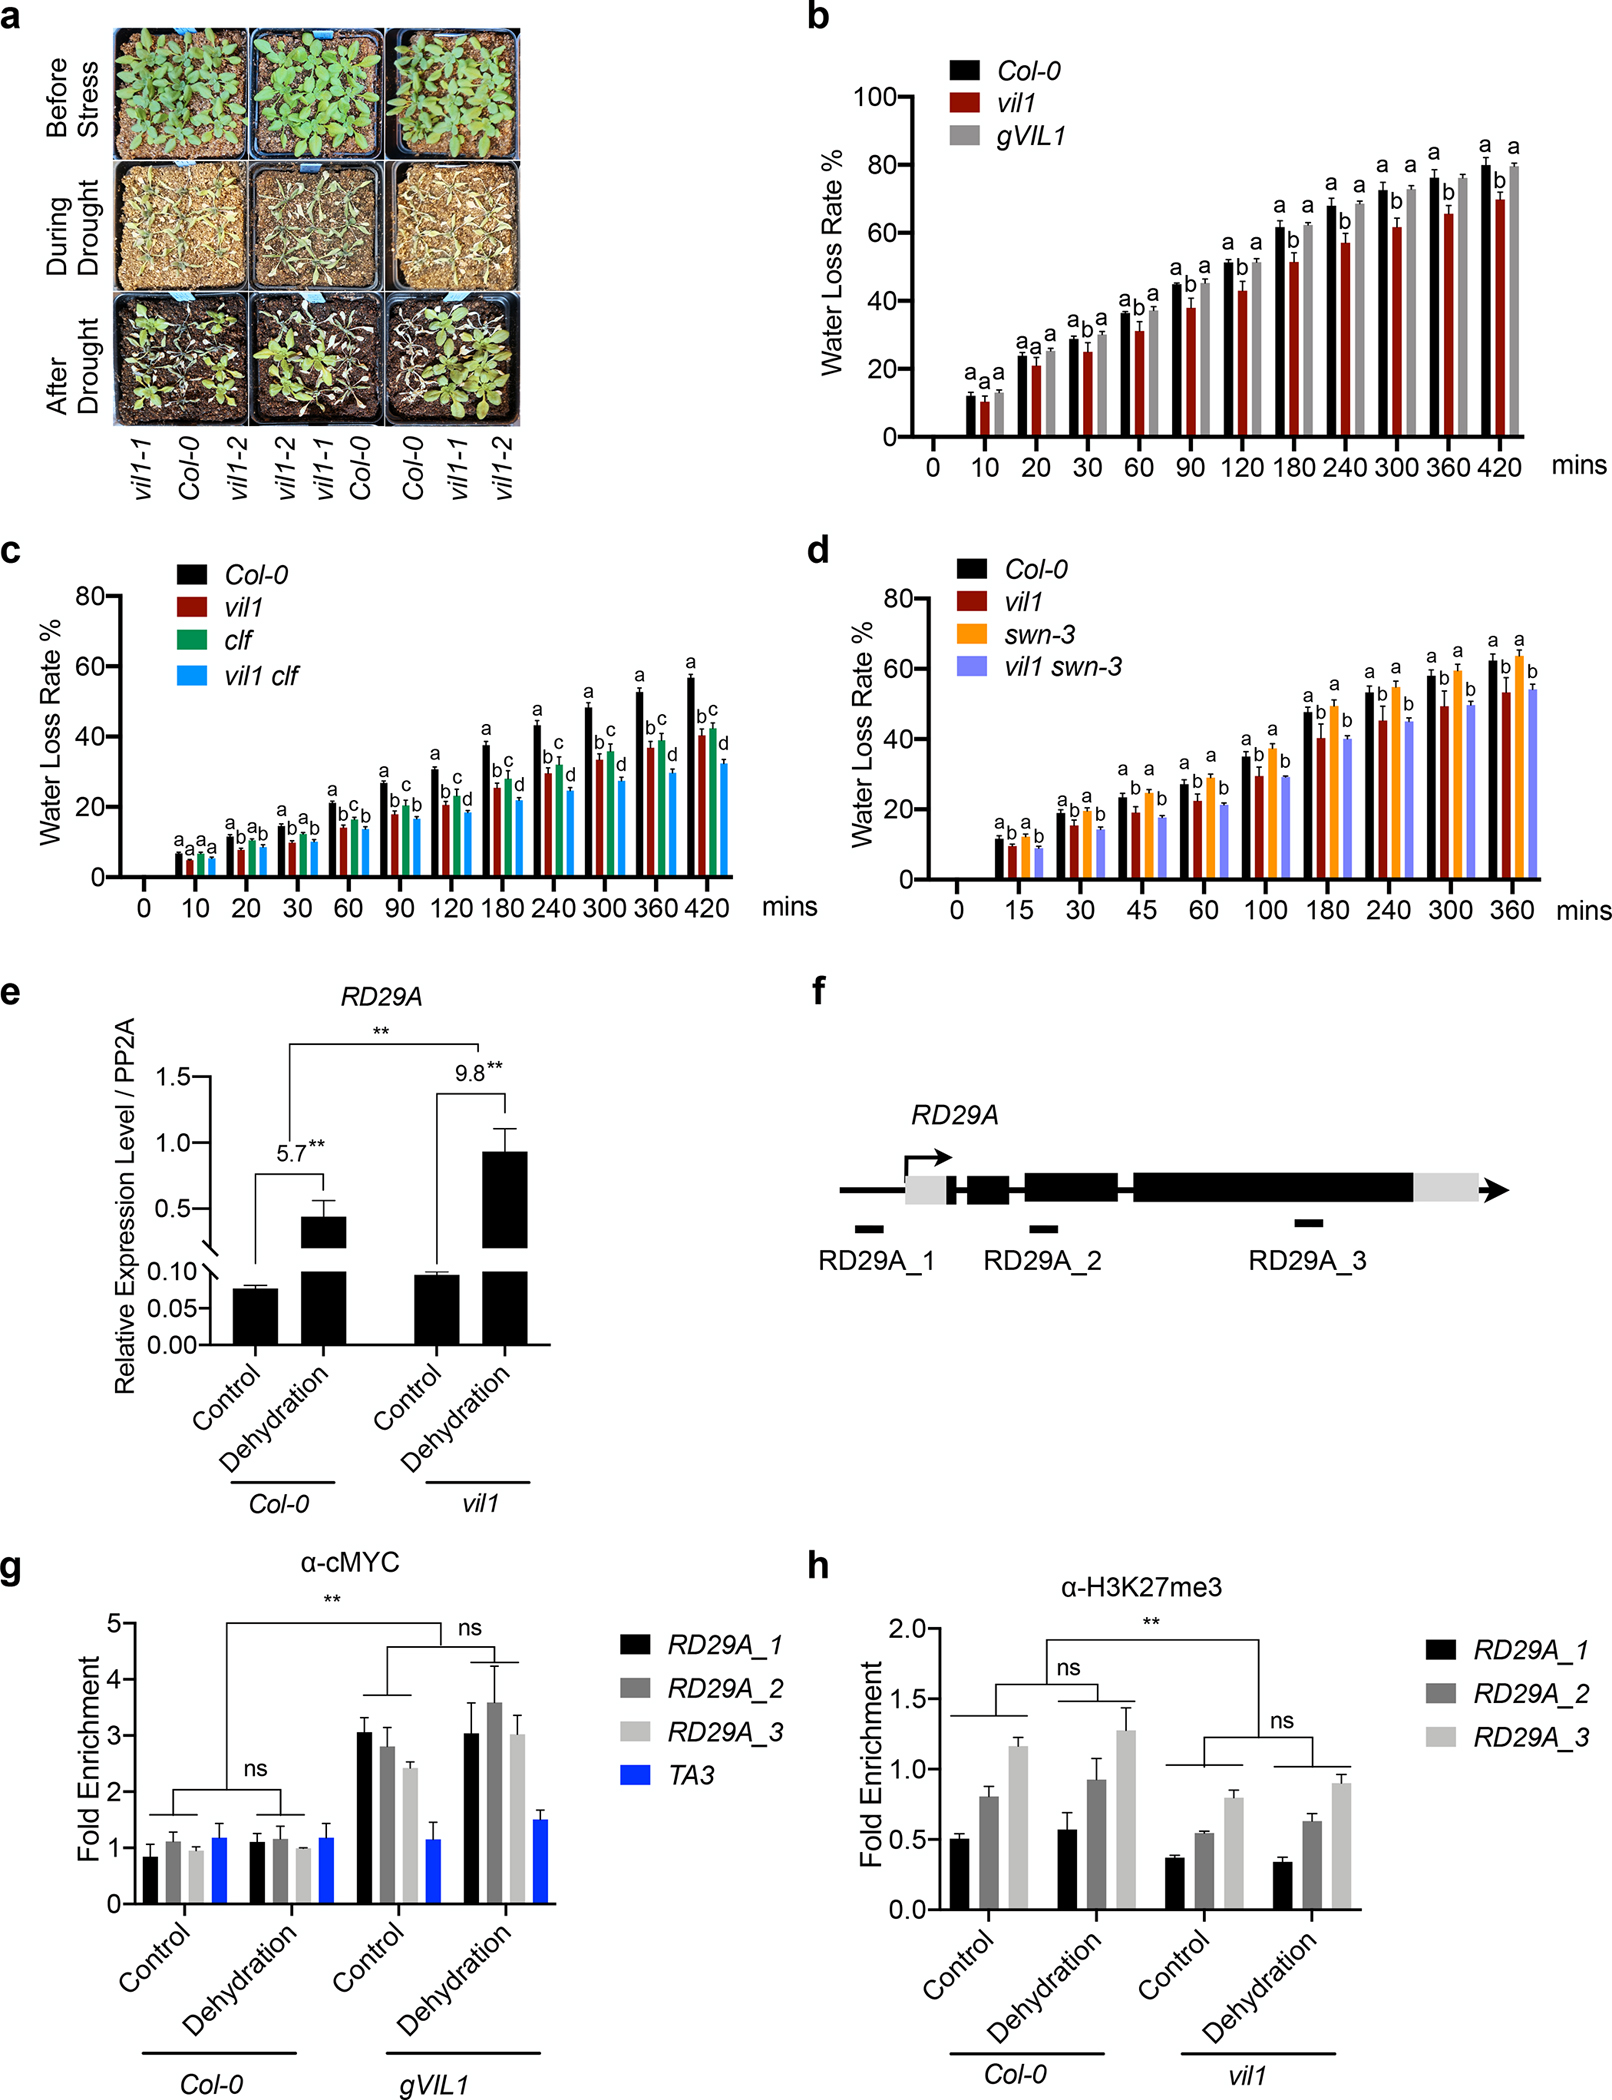
Enhanced drought tolerance of vil1 mutants in Arabidopsis. (a) Plant phenotypes for indicated genotypes before and after drought stresses. The phenotype of plants before drought (top), during (middle), and after re-watering (bottom). (b to d) Detached leaf water loss assays. Plants of Col-0, vil1, and gVIL1 are grown in long days (b). Plants of Col-0, vil1, clf, and vil1 clf are grown in short days (c). Plants of Col-0, vil1, swn-3, and vil1 swn-3 are grown in long days (d). Leaves with similar developmental stages were detached and weighted at the indicated time. Water loss represents the proportion of total weight loss compared with initial weight. Error bars: ±s. d. (n = 3). One-way ANOVA Tukey’s multiple comparison test was conducted; letters indicate P < 0.05 of distinct groups. (e) RT-qPCR analysis of RD29A expression under dehydration stress in Col-0 and vil1. Transcript levels were normalized to PP2A and error bars: ±s. d. (n = 3). The numbers (5.7 and 9.8) indicate fold changes between control and dehydration conditions in each genotype. (f) Schematic diagram showing the genome regions of RD29A. Exons are represented by black boxes, while black lines between exons represent introns. Black arrow with a vertical line indicates the transcription start site and the direction of arrow indicates the orientation of transcription. DNA fragments amplified in ChIP assays are labeled beneath the genomic regions. (g) Analysis of VIL1 binding to RD29A genomic regions with or without dehydration treatment for 1 hour. Enriched values were normalized with the level of input DNA and relative fold enrichment over Col-0 are presented. Error bars: ± s. d. (n = 3). (h) ChIP-qPCR analysis of H3K27me3 levels at RD29A in the Col-0 and vil1-1 seedlings with or without dehydration treatment for 1 hour. Each examined region was normalized to TA3 and error bars: ± s. d. (n = 3). **P < 0.01 and ns indicate no significant differences between distinct groups. Significant difference using Student’s t-test.