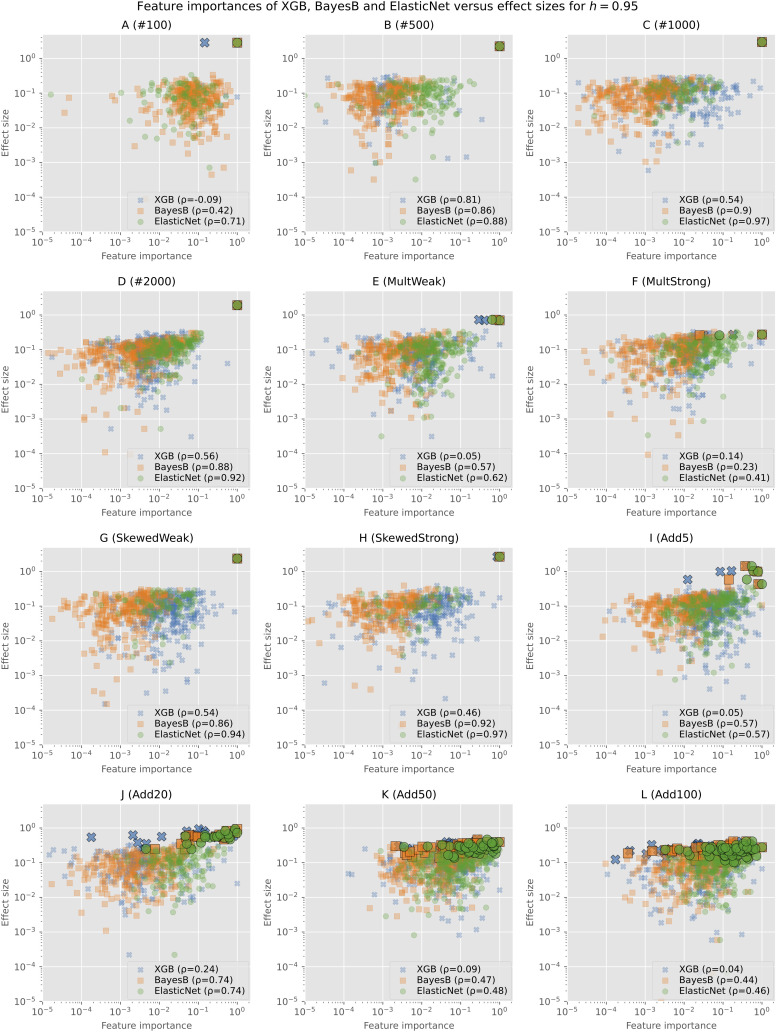
Figure 2.
Min–max normalized feature importances of Bayes B, Elastic Net, and XGB in comparison with effect sizes on synthetic data for h=0.95: Each subplot shows the results of one of the simulation configurations on a logarithmic scale. Only SNPs for which both the effect size and the feature importance are not zero are shown. Causal SNPs are highlighted by a larger marker size and a black frame. The legend additionally gives the Pearson correlation coefficient of the effect sizes and feature importances.

