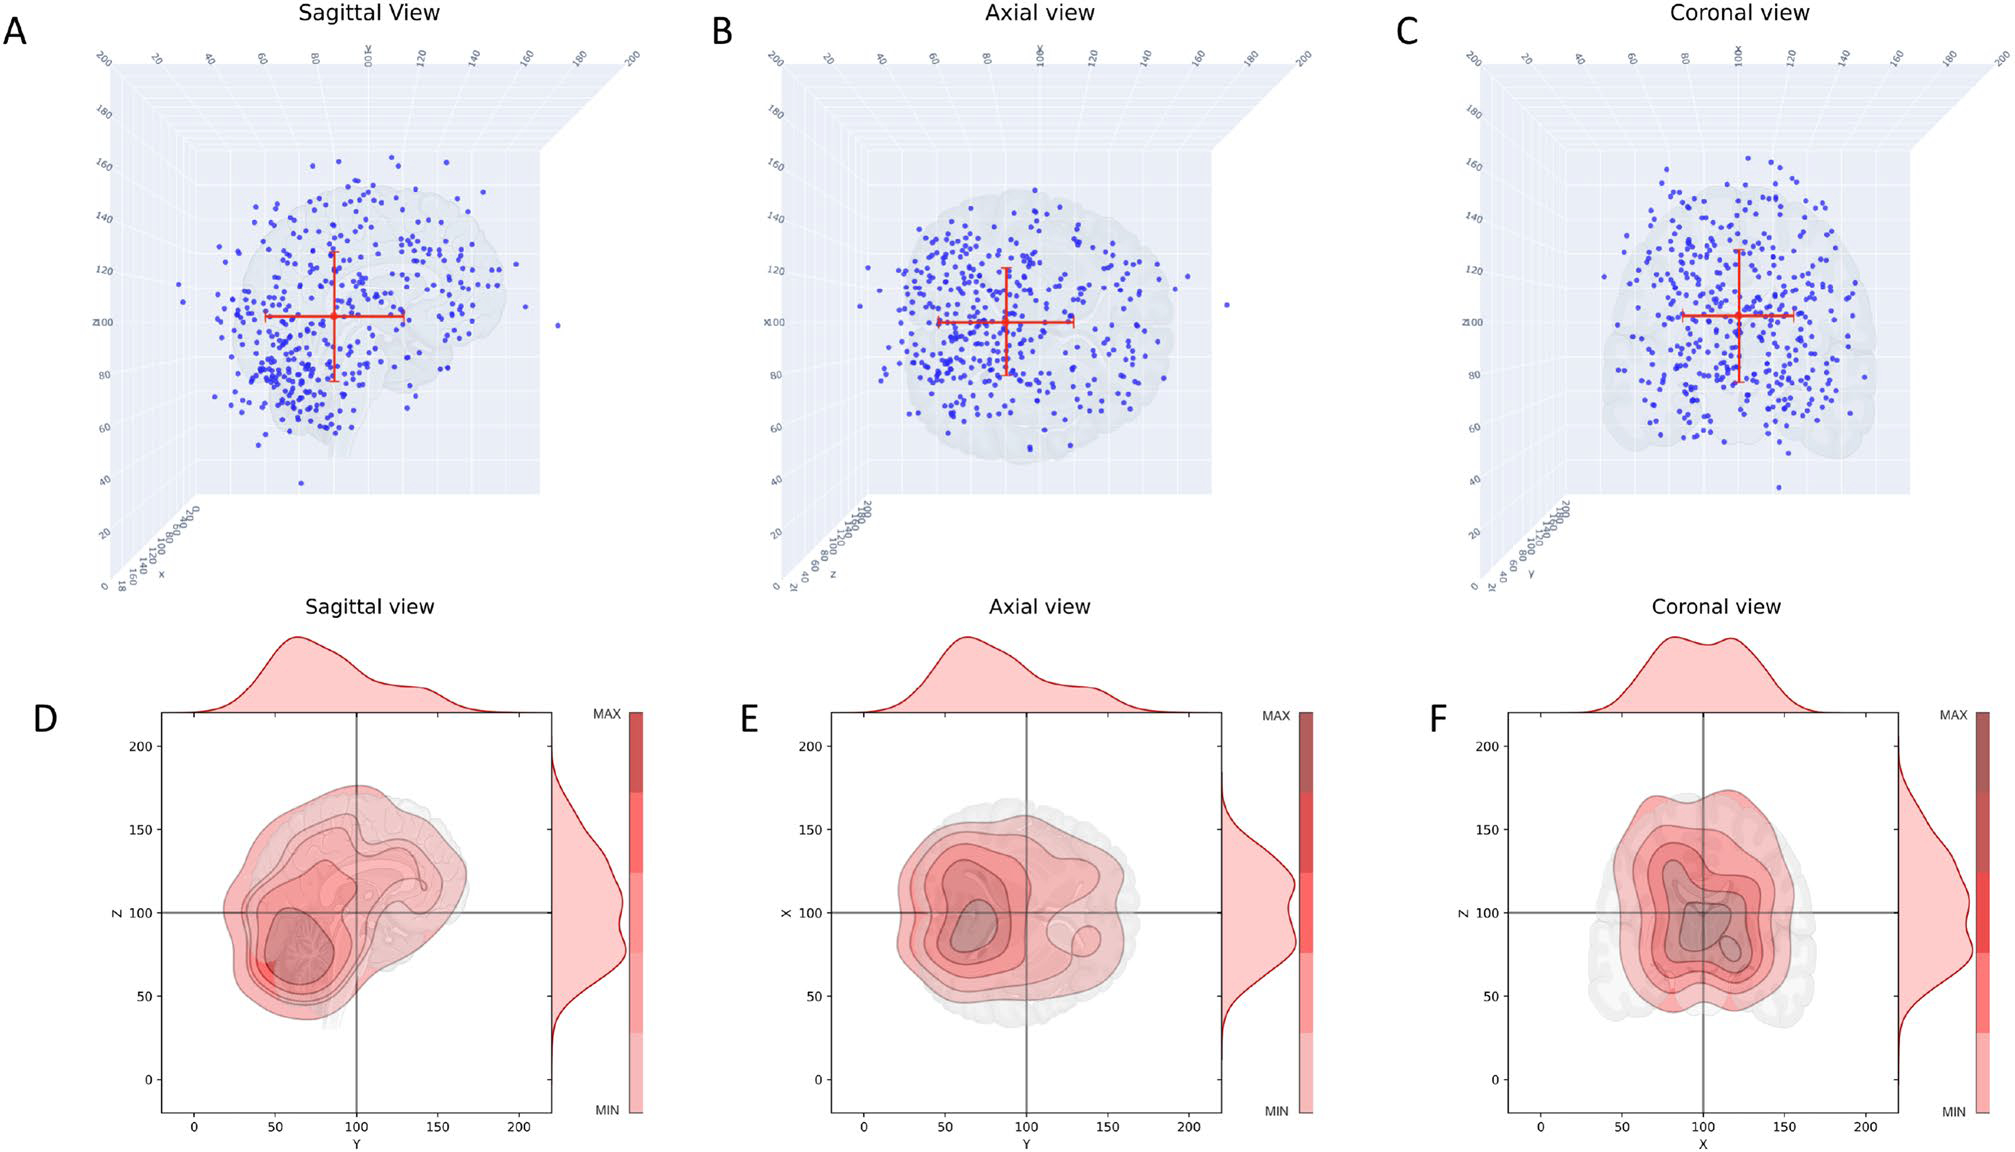
Fig. 1.

Scatter and kernel density plots showing the spatial distribution of metastatic brain tumors for all breast cancer patients in sagittal, axial, and coronal views. A Scatter plot, sagittal view, red dot indicates the mean; B Scatter plot, axial view, red dot indicates the mean; C Scatter plot, coronal view, red dot indicates the mean; D Kernel density plot, sagittal view. Color shading indicates density, closed dark regions indicate highest density of metastatic tumors. Distributions on top and right are probability distribution functions (pdf’s) describing the distribution of tumors. E Same as (D) axial view; F Same as (D), coronal view
