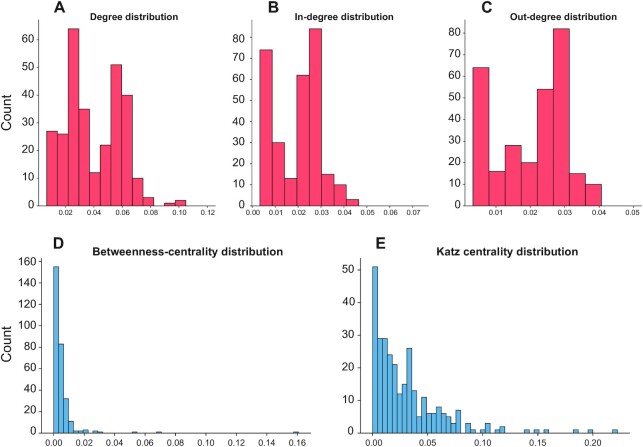
Figure 3.
Node centrality measures of the ND interaction network. (A) The histogram reports the distribution of the degree values of the nodes. (B) The histogram reports the distribution of the in-degree values of the nodes. (C) The histogram reports the distribution of the out-degree values of the nodes. (D) The histogram reports the distribution of the betweenness-centrality values of the nodes. (E) The histogram reports the distribution of the Katz centrality values of the nodes.

