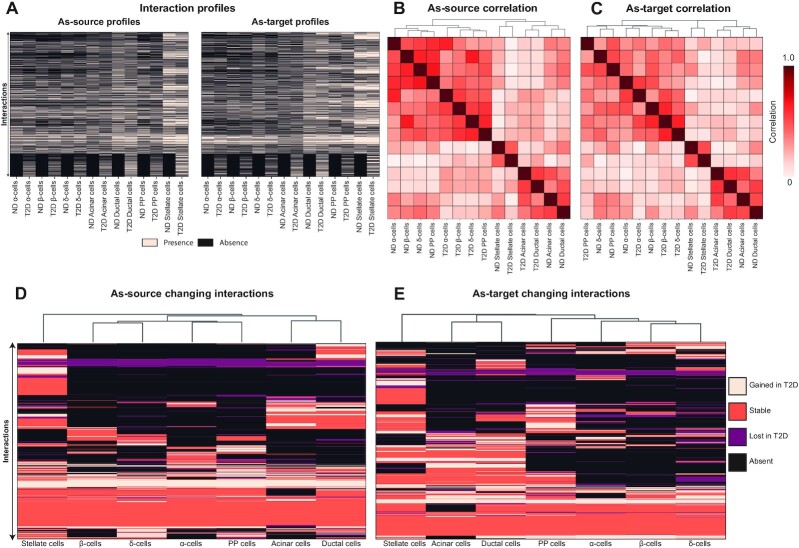
Figure 5.
Differences between ND and T2D interactome. (A) The presence/absence matrices report the presence and absence of the interactions (rows) in each cell type (columns) of the ND and T2D interactome. (B, C) The correlation matrices report the similarity between cell types of the ND and T2D interactome, in terms of spearman correlation between the interaction profiles, as-source (B) or as-target (C). The matrices are symmetrical and rows/columns have been clustered according to their similarities. The clustering results are indicated as dendrograms on the matrix margins. (D, E) The heatmaps report the changing interactions (rows) in each cell type (columns) in terms of spearman correlation between the interaction profiles, as-source (D) or as-target (E). The changing interaction profiles have been clustered according to their similarities, as indicated by the dendrograms on the top margins.

