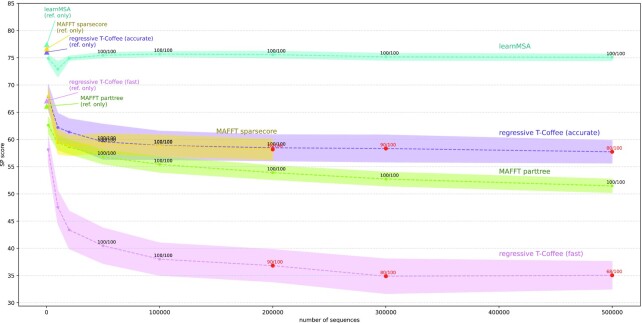
Figure 4:
Alignment accuracy as a function of family size. For evaluation purposes, increasing numbers of further homologs are added to a static set of reference sequences. The data points are labeled with the fractions of alignment tasks that produced an usable MSA at all. Missing data points indicate that the aligning method failed for the entirety of the datasets. In case of a failed alignment (due to hardware constraints), we inserted the score of the largest successful alignment in the respective series of nested sets, in favor of the aligning method. Therefore, the plot shows the behavior of the accuracy of the remaining MSAs under the (obliging) assumption that the failed MSAs are in theory unaffected by an increase in sequence numbers. Such incomplete data points are colored red. The shaded area is the standard deviations over the 10 samples, averaged over the families.

