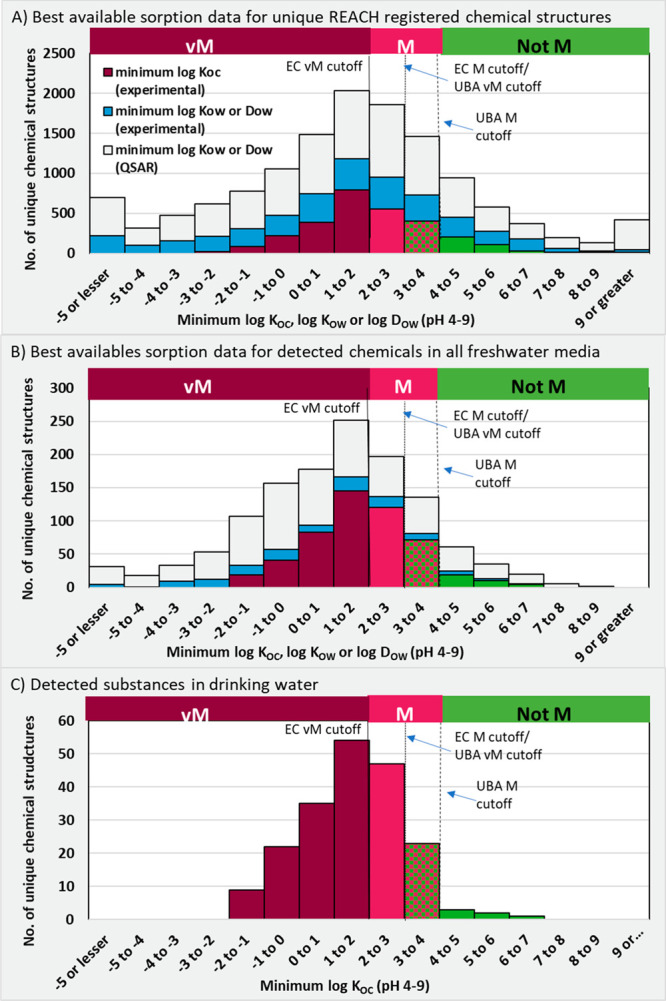
Figure 6.

Distribution of best available sorption data for unique chemicals identified in (A) the REACH registered list of substances and (B) detected chemicals in freshwater environments. Also presented is (C) minimum experimental log KOC values for substances detected in drinking water (n = 196). Also presented is the UBA’s M and vM thresholds (cutoffs) proposed in 2019 at log KOC 4.0 and 3.0, respectively, as well as the EC proposed M and vM thresholds (cutoffs) proposed in 2021 at log KOC 3.0 and 2.0, respectively. Experimental log KOC values are shown in different colors based on their relation to these thresholds (dark fuchsia and fuchsia = vM and M, respectively, according to the EC proposed criteria; tiled = M according the UBA proposed criteria, not M according to the EC proposed criteria only, green = Not M).
