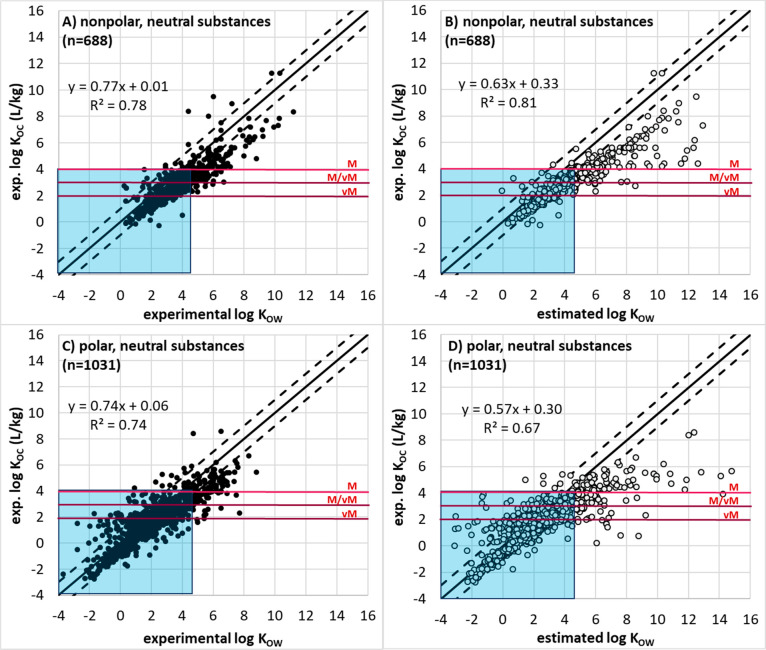
Figure 7.
Experimental log KOC–log KOW plots for neutral substances, showing (A) nonpolar substances and experimental log KOW values, (B) nonpolar substances and estimated log KOW values, (C) polar substances and experimental log KOW values, and (D) polar substances and estimated log KOW values. Here polar substances are considered those with a mass fraction of oxygen and nitrogen being 12% or above of the molecular mass. The solid line indicates the 1:1 line, with the two dotted lines showing deviations of a factor 10. Shaded blue areas indicate the area with a log KOC < 4.0 and log KOW < 4.5 to visually illustrate the proportion of substances meeting both the KOC criteria and KOW screening criteria the UBA proposed in 2019.20 Also presented in red lines are the current log KOC based mobile and very mobile criteria the UBA proposed in 2019, with thresholds at <4.0 and <3.0, and the EC proposed in 2021, with thresholds at <3.0 and <2.0.

