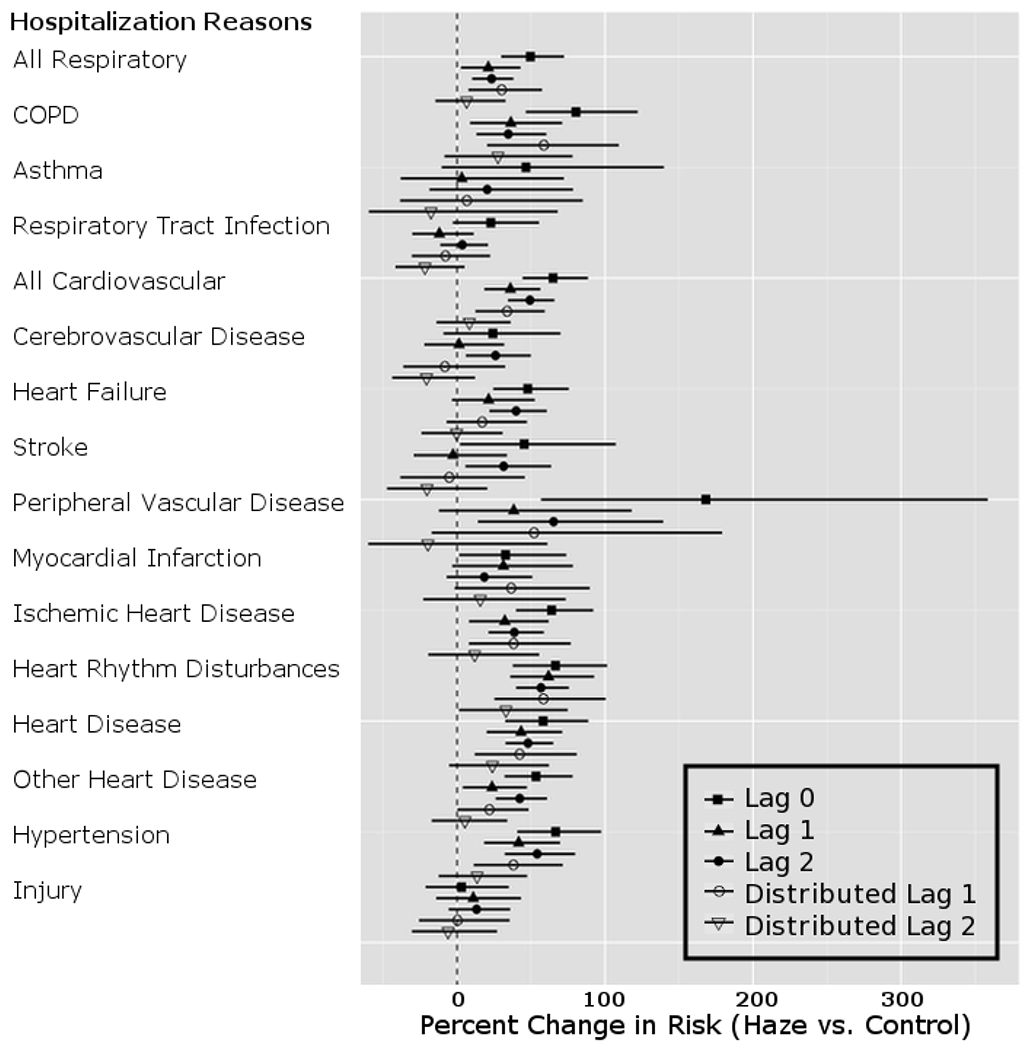
Figure 4.

Percent change and 95% CI in hospital related admissions for the haze period compared to the non-haze period in the affected region controlling for PM2.5, temperature, and dew point.
Note: Percent increase in admissions for the haze period compared to the non-haze period.
