
Fig. 4 |. CellTrek identifies the spatial subclone heterogeneity in DCIS1.
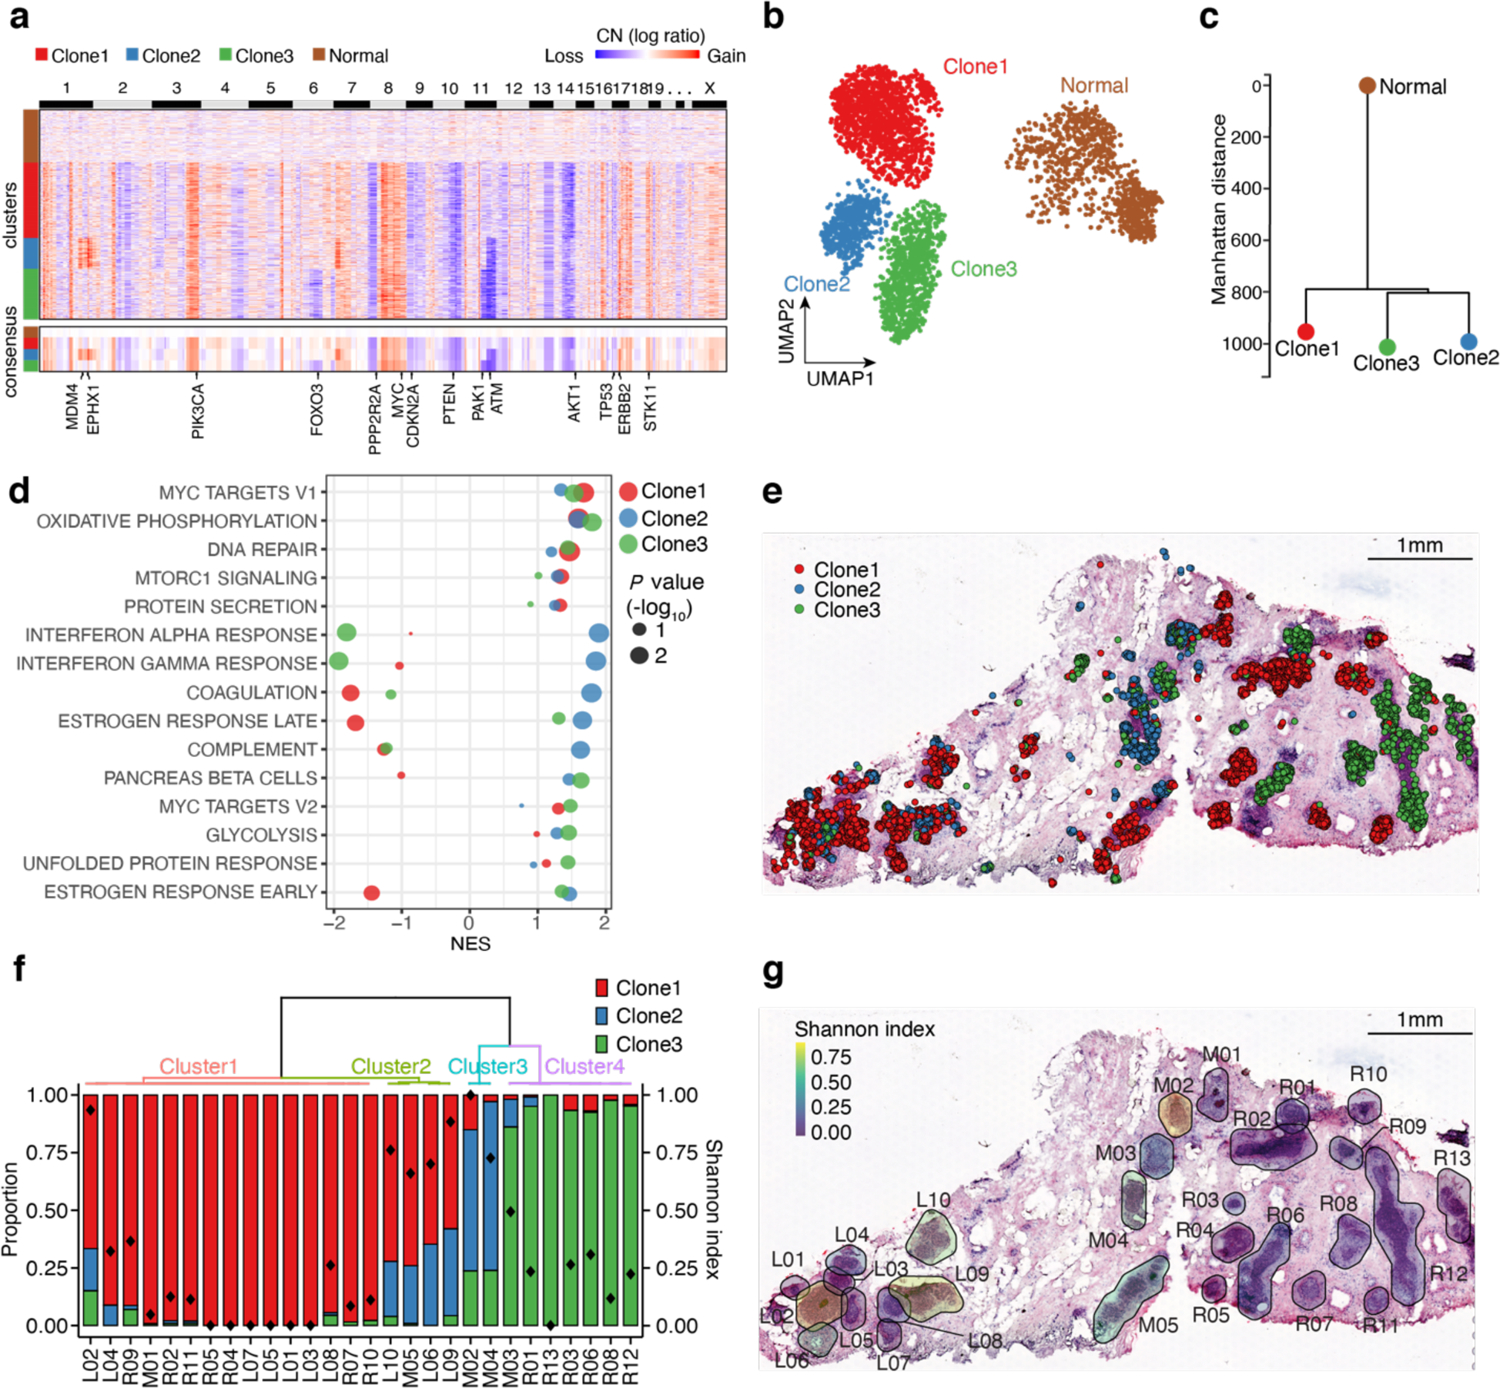
a, A heatmap of copy number (CN) profiles inferred by CopyKAT on the scRNA-seq data in DCIS1. The lower part represents a consensus CN profile of each cluster with some breast cancer-related genes annotated. b, CN-based UMAP of DCIS1. c, Phylogenetic tree based on the consensus CN profiles. d, Hallmark GSEA analysis of the expression data from three tumor subclones. e, Spatial cell charting of three tumor subclones using CellTrek. f, Tumor subclonal compositions within different ducts. The diamond symbol in each bar represents the Shannon index which measures the diversity of tumor subclones. g, H&E image of the DCIS tissue section with Shannon diversity index for each duct.