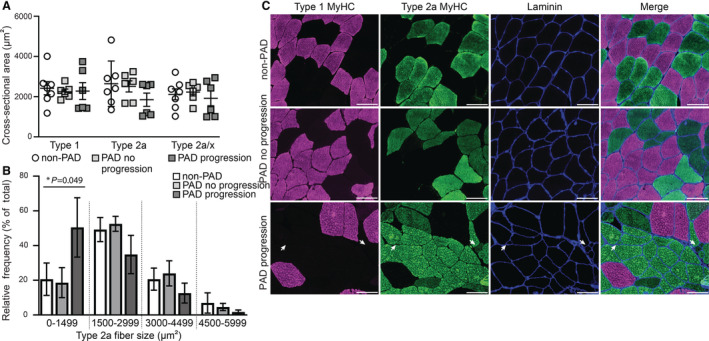
Figure 3. Smaller Type 2a fiber size in gastrocnemius muscle from subjects with PAD with functional decline (PAD progression).

A, Average fiber size (cross‐sectional area) stratified by fiber type within subjects without PAD (non‐PAD; n=7), subjects with PAD without functional decline (PAD no progression; n=6), and subjects with PAD and functional decline (PAD progression; n=6). Data expressed as mean ± SEM. B, Relative frequency distribution of Type 2a muscle fiber size. Each bar represents the percent of total fibers within the specified fiber size bin (1500‐μm width). Note, a greater number of small Type 2a fibers (0–1499 μm2) within gastrocnemius muscles from the PAD progression group. A mixed effects model was used to determine differences among groups (*P value); however, multiple comparisons were not performed because of the small sample sizes. A linear mixed‐effects model was used to determine significant differences in cross‐sectional area and relative frequency within Type 2a fiber size ranges between non‐PAD and PAD progression (0–1499, P=0.031). C, Representative images of immunohistochemistry depicting fibers expressing Type 1 MyHC (myosin heavy chain, pink), Type 2a MyHC (green) and fiber borders (laminin, blue) from the gastrocnemius muscle of non‐PAD (top), PAD no progression (middle) or PAD progression (bottom). White arrows point to several small Type 2a fibers. MyHC indicates myosin heavy chain; and PAD, peripheral artery disease. Scale bar=100 μm.
