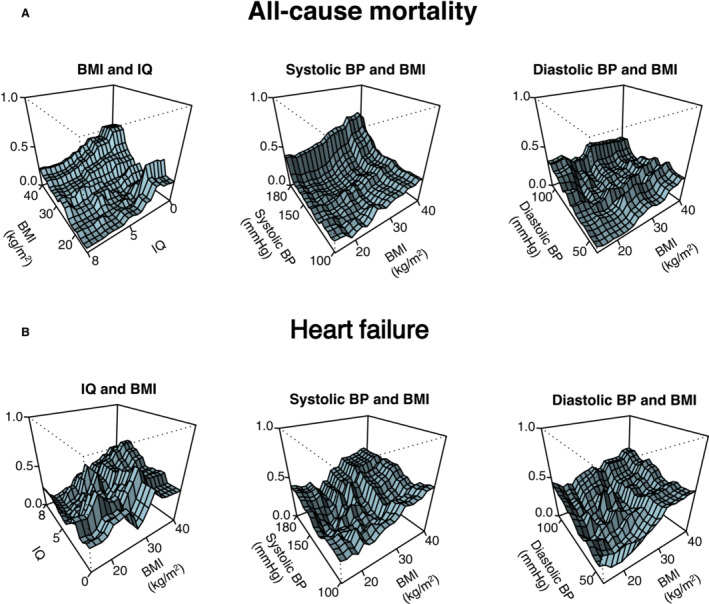
Figure 3. Three‐dimensional partial dependence plots generated from the random forest models.

Graphical visualization of the most important interactions between body mass index (BMI) and risk factors (x 1 and x 2 axis) on all‐cause mortality (A) and incident heart failure (B) (y axis). The y axis denotes probability of all‐cause mortality or incident heart failure. A, Intelligence quotient (IQ) is in the reverse direction from high to low. BP indicates blood pressure.
