
Figure 2. Shift in multinomial CKD risk category prevalence between exam years 10 and 30.
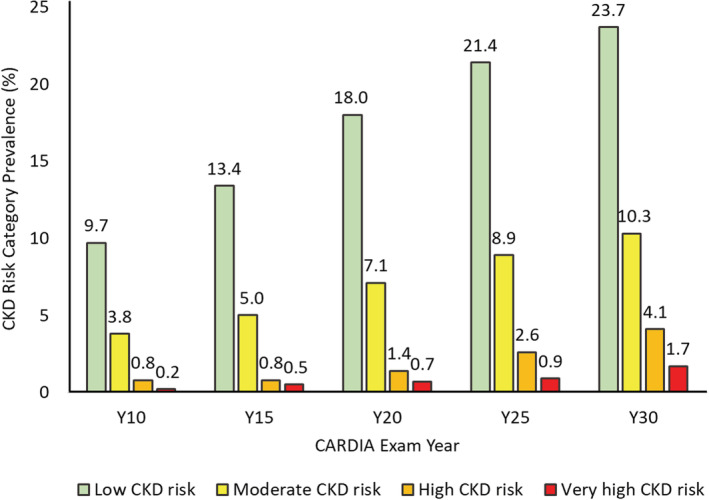
Sample size with kidney function markers obtained or found with severe kidney disease on annual followup varied across exams, namely, 3461, 3311, 3369, 3403, and 3010 at exam years 10, 15, 20, 25, and 30, respectively. Cumulative worst CKD risk category for each exam, carrying forward the most recent nonmissing value in the case of missing information, was therefore obtained in 3461, 4032, 4261, 4376, and 4382 participants from exam years 10 to 30 exam. Number of new entries at exam years 15, 20, 25, and 30 were 571, 229, 115, and 6, respectively. Numbers in the very low CKD risk category at exam years 15, 20, 25, and 30 were 2966 (85.7%), 3240 (80.4%), 3113 (73.1%), 2907 (66.4%), and 2651(60.5%), respectively. CKD risk category classification was cumulative over time. Participants were classified in a CKD category at their first attended examination and that classification was updated at the next examination or carried forward if the next examination was missed. CARDIA indicates Coronary Artery Risk Development in Young Adults; and CKD, chronic kidney disease.