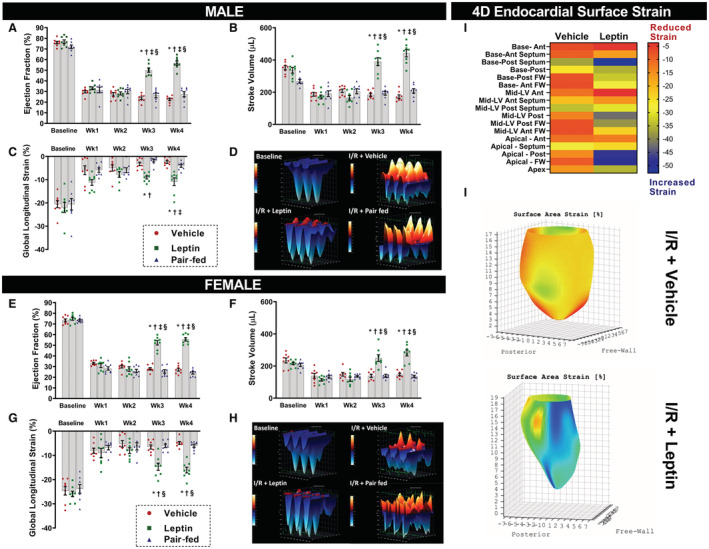
Figure 2. Cardiac function assessed by echocardiography at baseline and at weeks 1 to 4 of central leptin infusion post‐I/R in male and female rats.

A, and E, Ejection fraction; (B and F) stroke volume; (C and G) global longitudinal strain. D and H, are 3‐dimensional representations of longitudinal strain in male and female rats at baseline (top left) and 4 weeks post‐I/R in vehicle‐treated (top right), leptin‐treated (left bottom) and pair‐fed (right bottom) rats. I and J, are a heat map representation of regional endocardial surface strain and a 4‐dimensional reconstruction of the endocardial surface strain, respectively, in vehicle and leptin‐treated animals analyzed by 4‐dimensional echocardiography technology (Videos [Link], [Link]) (n=8 per sex/group). * Vs vehicle, P<0.05; † vs pair‐fed, P<0.05. ‡ Vs leptin Wk2, P<0.05; § vs leptin Wk1, P<0.05. Two‐way repeated measures ANOVA (A through D and E through H). FW indicates free wall; I/R, ischemia/reperfusion; and LV, left ventricle.
