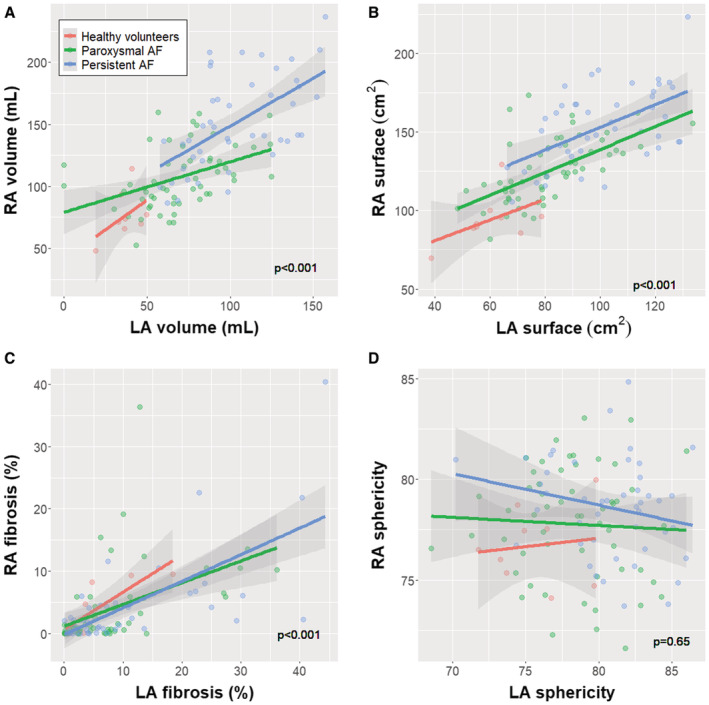
Figure 4. Correlation between remodeling parameters in the RA and LA.

The correlation between right and left atrial volume (A), surface (B), fibrosis (C), and sphericity (D) is plotted. The P value reports the significance of the correlation in a linear regression model. The interaction term including the group was nonsignificant in all cases. AF indicates atrial fibrillation; LA, left atrium; and RA, right atrium.
