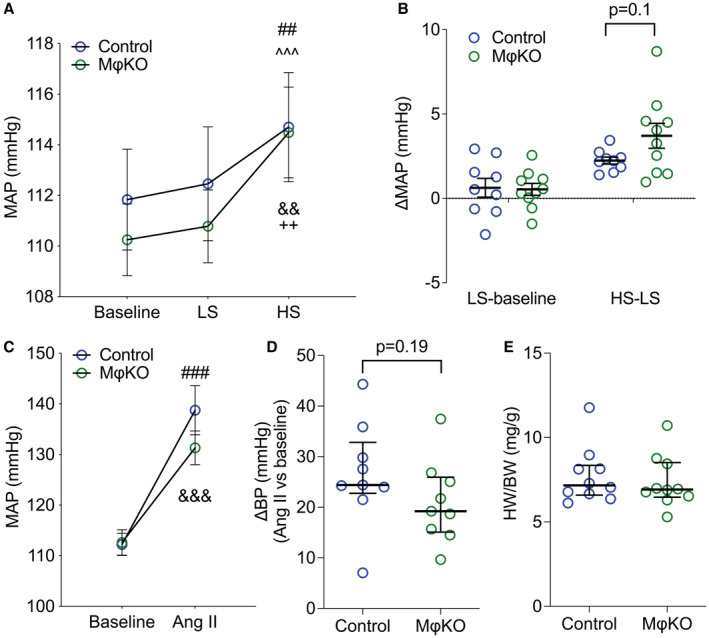
Figure 1. Mice lack EP4R in macrophages maintained normal salt sensitivity and BP response to Ang II.

(A) The MϕKOs have similar MAP measured by telemetry at baseline and during low‐ or high‐salt feeding (1 week respectively) compared with Controls. (B) The BP changes from normal to low‐salt feeding and low‐ to high‐salt feeding periods were also similar between genotypes. (C) The mice received Ang II infusion for 3 weeks, and the averaged MAP during the week 2 to 3 of the Ang II infusion period was similar between Control and MϕKO mice. (D) The Ang II‐induced MAP increase tends to be higher in MϕKOs than in Control mice; however, the difference was not statistically significant. (E) The heart weight/body weight ratio was at the same level in Controls and MϕKOs following Ang II infusion. Data in (A through C) are expressed as mean±SEM and analyzed by 2‐way ANOVA (factors: genotype and treatment) with Sidak multiple comparisons tests; data in (D and E) are expressed as median and interquartile range and analyzed by Mann–Whitney test; n=9 to 10/group; ## P<0.01, ### P<0.001 vs Control baseline; ^^^ P<0.001 vs Control LS; && P<0.01, &&& P<0.001 vs KEKO baseline; ++ P<0.01 vs KEKO LS; effect size: trivial for (A), large for (C). Ang II indicates angiotensin II; BP, blood pressure; HS, high salt; HW/BW, heart weight/body weight ratio; KEKO, kidney epithelial cell‐specific EP4 receptor knockout; LS, low salt; MAP, mean arterial pressure; and MϕKO, macrophage‐specific EP4 receptor knockout.
