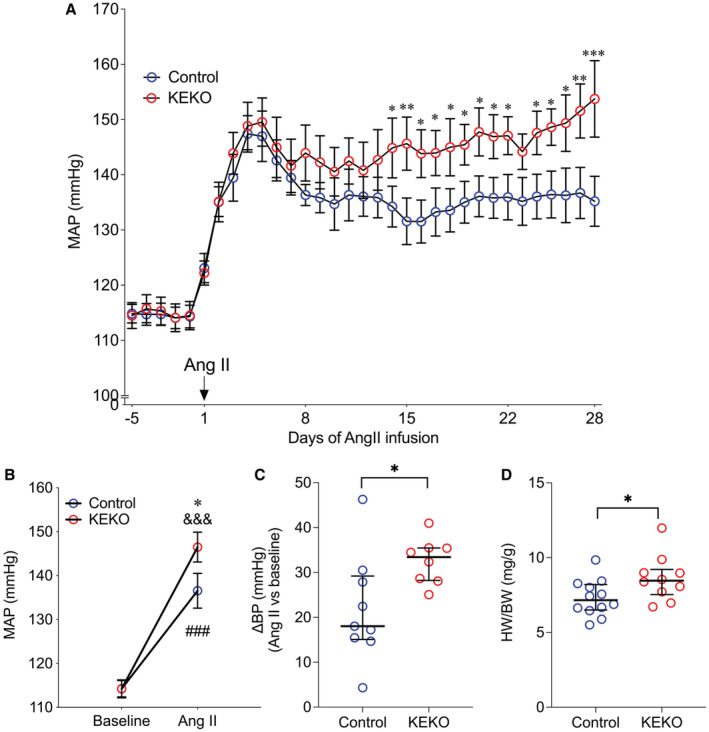
Figure 3. Eliminating EP4R from kidney tubular epithelial cells leads to exaggerated BP response to Ang II.

(A) KEKO mice have significantly higher MAP after day 14 of Ang II infusion than Controls. (B) The averaged MAP of week 3 to 4 of Ang II infusion was significantly higher in KEKO mice than Controls. (C) The Ang II‐induced MAP increase was exacerbated significantly in KEKO mice. (D) The heart weight/body weight ratio was significantly higher in KEKO mice than Controls following Ang II infusion. Data in (A and B) are expressed as mean±SEM and analyzed by 2‐way ANOVA (factors: genotype and days for A; genotype and treatment for B) with Sidak multiple comparisons tests; data in (C and D) are expressed as median and interquartile range and analyzed by Mann–Whitney test; *P<0.05, **P<0.01, ***P<0.001 vs Control at the same time point or the same treatment (effect size: medium—large for (A), large for (Bfollowing Ang II infusion through D); ### P<0.001 vs Control baseline (effect size: large); &&& P<0.001 vs KEKO baseline (effect size: large); n=9 to 12/group in (A and B); n=8 to 10/group in (C and D); Ang II indicates angiotensin II; BP, blood pressure; EP4R, E‐prostanoid receptor 4; HW/BW, heart weight/body weight ratio; KEKO, kidney epithelial cell‐specific EP4 receptor knockout; and MAP, mean arterial pressure.
