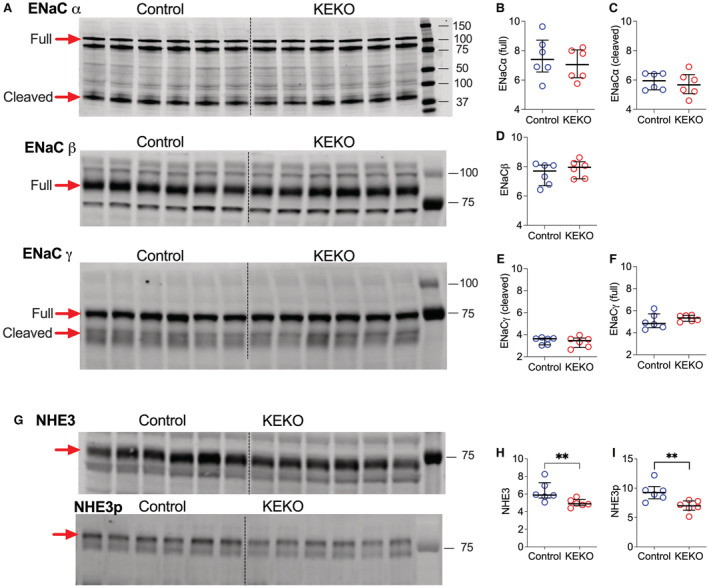
Figure 6. The protein abundance of ENaC and NHE3 during Ang II‐HTN.

The proteins were extracted after 14 days of Ang II infusion. (A) Gel images of Western blotting for ENaC subtypes. (B through F) Quantification of the western blotting for ENaC subtypes. The full length or cleaved ENaCα, ENaCβ, or ENaCγ proteins in the kidney were similar in Control and KEKO mice. (G) Gel images of western blotting for NHE3 and phosphorylated NHE3 (NHE3pS552). Both NHE3 (H) and NHE3pS552 (I) protein levels were significantly reduced in KEKOs. Data are expressed as median with interquartile range and analyzed by Mann–Whitney test; **P<0.05 (effect size: large); n=6/group; ENaC indicates epithelial sodium channel; KEKO, kidney epithelial cell‐specific EP4 receptor knockout; and NHE3, sodium‐hydrogen antiporter 3.
