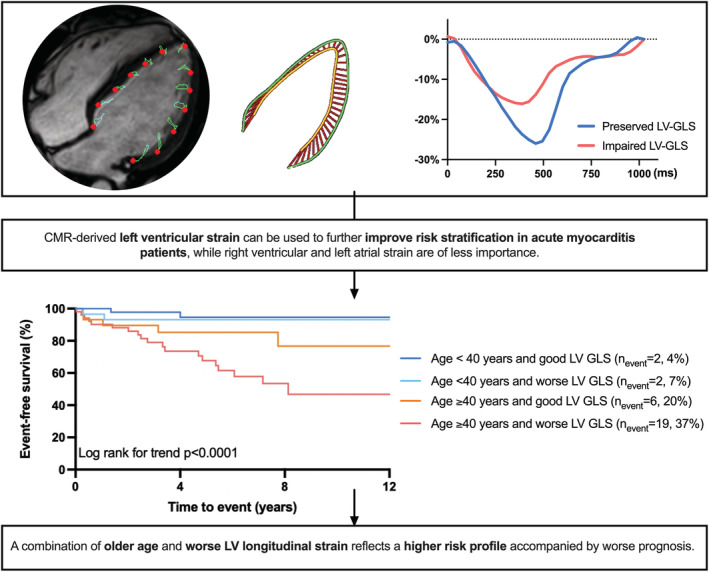
Figure 3.

Kaplan–Meier survival analysis of four risk groups combining age and LV‐GLS.
Good LV‐GLS is defined as LV‐GLS better than −22%, worse LV‐GLS is defined as worse than −22%. Patients that are 40 years or older and have LV‐GLS worse than −22% had a worse outcome as compared to the other groups. Patients younger than 40 years tend to have a good prognosis, irrespective of LV‐GLS. GLS indicates global longitudinal strain; and LV, left ventricular.
