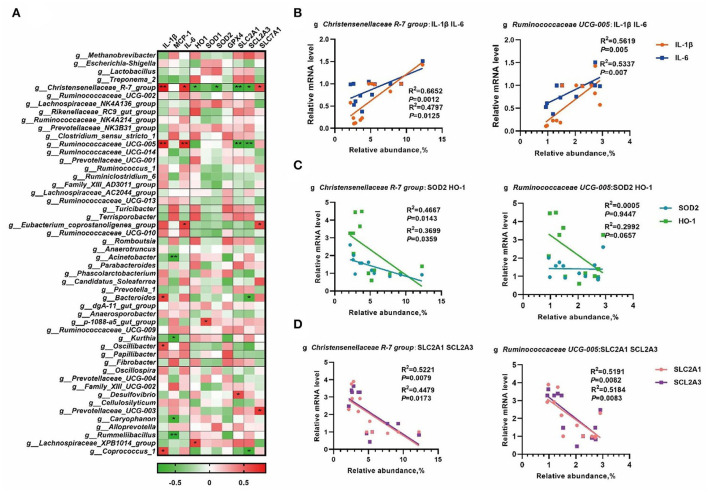
Figure 6.
The correlation analysis of the gut microbiota and placental gene expression. The correlation analysis between the abundance of the top 50 microbial genera and placental gene expression by Spearman's correlation analysis (A), linear regression analyses between genera and placental mRNA expression of inflammatory cytokines (B), mRNA expression of antioxidative genes (C), and expression of genes involved in the regulation of nutrient transport in placenta (D). *, p < 0.05; and **, p < 0.01.

