Fig. 3.
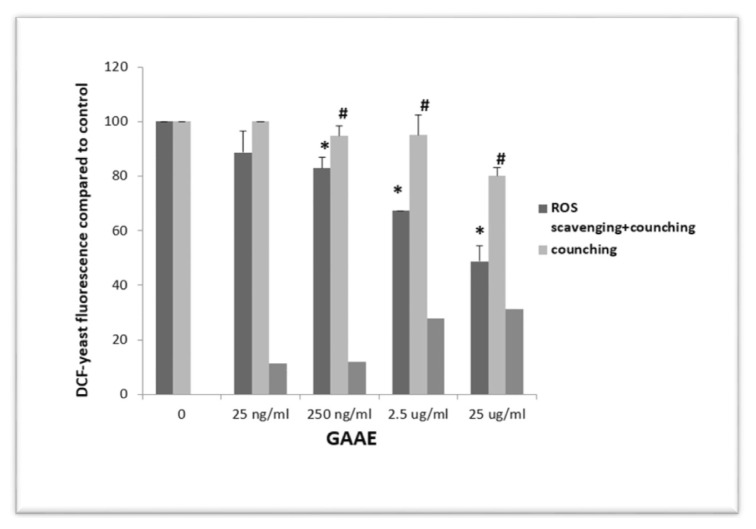
Distinction between ROS scavenging and signal quenching of GAAE against DCF-yeast.
Flow cytometry data from DCFH2-A405 yeast were analyzed quantitatively. The first column on the left (dark grey) represents DCFH2-A405 yeast incubated with GAAE (25 ng/ml, 250 ng/ml, 2.5 μg/ml, and 25 μg/ml) and H2O2 for 30 minutes for each condition (1 mM). The second column (light grey) shows DCFH2-A405 yeast that has been pre-oxidized with H2O2 (1 mM), washed, and incubated with GAAE (25 ng/ml, 250 ng/ml, 2.5 μg/ml, and 25 μg/ml) for 30 minutes. This circumstance determines the quenching of DCF fluorescence by GAAE. The third column (medium grey) shows the difference between the two initial columns defining ROS scavenging activity is shown by the third column (medium grey). The median fluorescence of the results is normalized to the positive control (oxidized DCF-yeast without extract). The experiment was performed three times with the same findings. *p 0.05 compared to the positive control and #p 0.05 compared to the scavenging + quenching impact of each GAAE dose (Student-test).

