. 2022 Nov 16;14(1):2145929. doi: 10.1080/19420862.2022.2145929
© 2022 The Author(s). Published with license by Taylor & Francis Group, LLC.
This is an Open Access article distributed under the terms of the Creative Commons Attribution License (http://creativecommons.org/licenses/by/4.0/), which permits unrestricted use, distribution, and reproduction in any medium, provided the original work is properly cited.
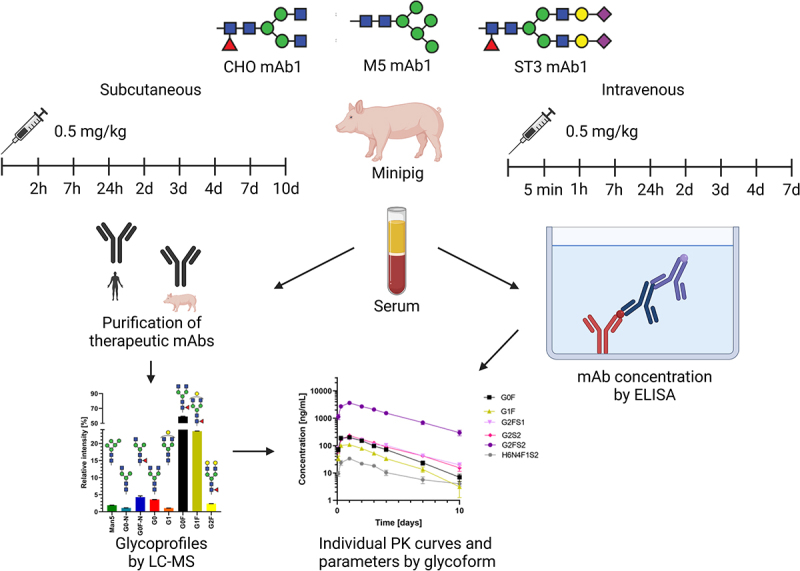
Figure 1.

Overview of animal experiments and analytical workflow.
