
Figure 2.
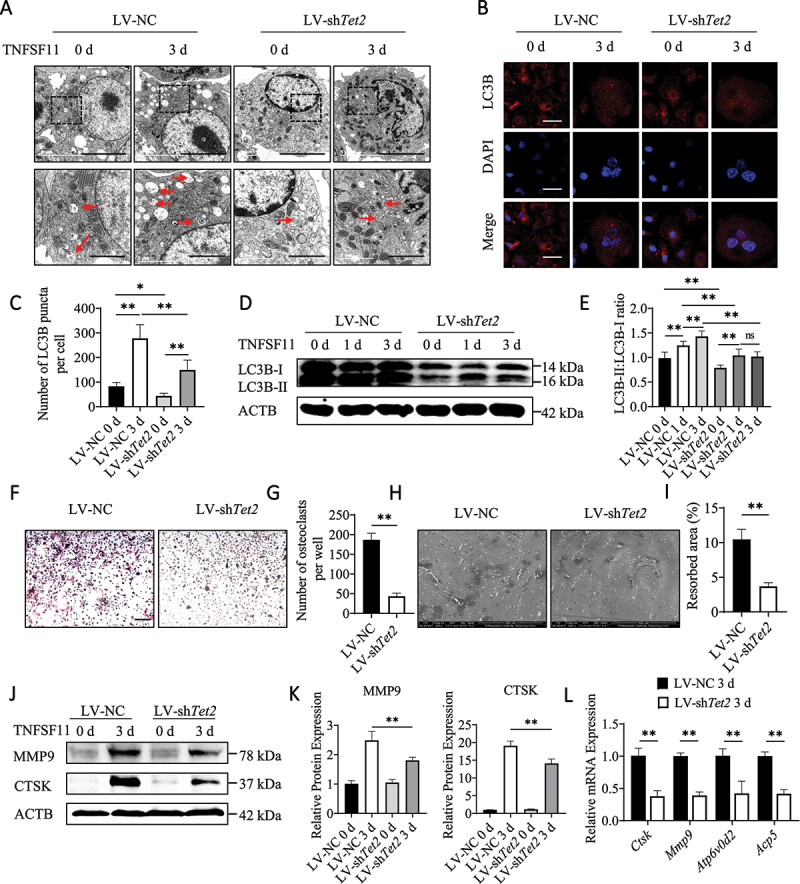
Effect of TET2 on autophagy during osteoclastogenesis. (A) Autophagosomes and autolysosomes in BMs after transfection with LV-NC or LV-shTet2 lentivirus and stimulation with TNFSF11 for 3 days were observed via TEM. Red arrows indicated autophagosomes or autolysosomes. The experiment was performed 3 times, and 15 different cells were randomly counted per experiment. Scale bars: 5 µm and 2 µm. (B) Images of LC3B puncta in the different groups. The experiment was performed 3 times, and 15 different cells were randomly counted per experiment. Scale bars: 10 µm. (C) Quantification of the LC3B puncta per cell in the different groups. (D) Western blot analysis was performed to determine changes in the expression levels of autophagic molecules in the different groups during osteoclast differentiation. (E) The western blot results were quantified. (F) ACP5 staining was used to analyze osteoclast differentiation. Scale bars: 200 µm. (G) ACP5-positive cells from 2.5 × 10⁴ BMs per well were quantified (n = 3, three independent experiments with three replicates each). (H) Scanning electron micrographs of bone resorption pits. Scale bars: 500 µm. (I) The ratio of bone resorption pits in the entire area of a piece of a bovine bone slice was calculated. (J) The expression levels of MMP9 and CTSK in BMs after transfection with LV-NC or LV-shTet2 lentivirus and stimulation with TNFSF11 for 3 days were analyzed by western blotting. (K) The western blot results were quantified. (L) The mRNA levels of Ctsk, Mmp9, Atp6v0d2, and Acp5 were analyzed in BMs transfected with LV-NC or LV-shTet2 lentivirus after TNFSF11 stimulation for 3 days. The data are expressed as the mean ± SEM (* P < 0.05, ** P < 0.01, n = 3, three independent experiments were performed at an interval of 2–4 weeks, and each group was repeated three times).