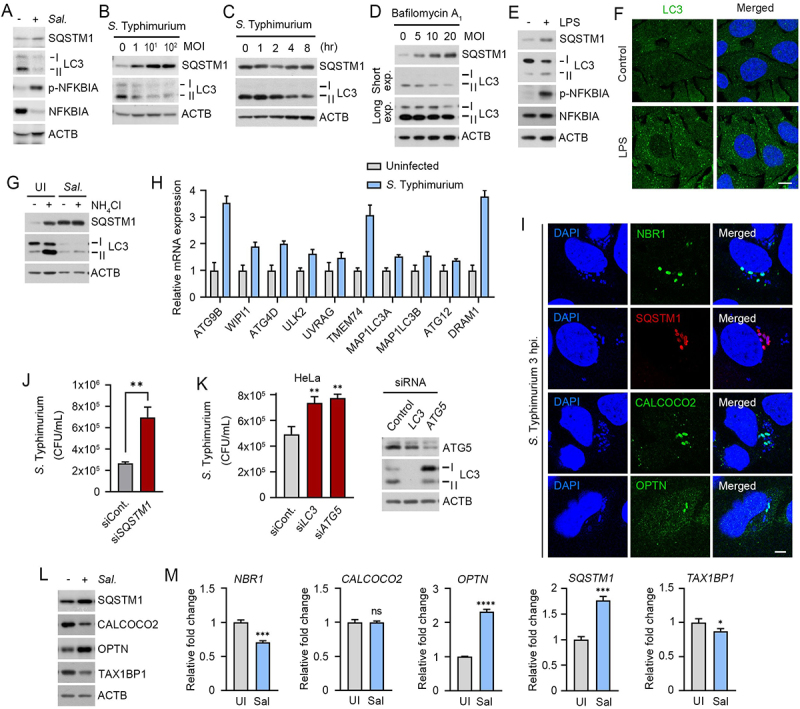
Figure 1.

Counteractive crosstalk between S. Typhimurium and host cells via autophagy. (A) RAW264.7 cells were infected with S. Typhimurium of MOI 10 for 6 h and analyzed by immunoblotting. (B) RAW264.7 cells were infected with S. Typhimurium of indicated multiplicity of infection (MOI) for 6 h and analyzed by immunoblotting. (C) HeLa cells were infected with S. Typhimurium of MOI 10 for indicated time periods and analyzed by immunoblotting. (D) RAW264.7 cells were infected with S. Typhimurium of indicated MOI and treated with 100 nM bafilomycin A1 for 4 h before analyzing by immunoblotting. (E) RAW264.7 cells were treated with 100 ng/mL LPS for 6 h and analyzed by immunoblotting. (F) Puncta formation assay of LC3 (green) in HeLa cells treated with 100 ng/mL LPS for 6 h. Scale bar: 10 μm. (G) RAW264.7 cells were infected with S. Typhimurium for 5 h and followed by 1 h 20 mM NH4Cl treatment for autophagy flux analysis. (H) Relative fold change in mRNA level of autophagy related genes in uninfected and S. Typhimurium-infected HeLa cells were analyzed by RT-qPCR. (I) HeLa cells were infected with S. Typhimurium MOI of 10 for 3 h. Scale bar: 5 μm. (J) Graph of CFU indicating intracellular S. Typhimurium in HeLa cells transfected with siRNA control or siRNA targeting SQSTM1. (K) Graph of CFU indicating intracellular S. Typhimurium in HeLa cells transfected with siRNA control or siRNA targeting LC3 or ATG5 (left panel). Immunoblotting analysis of siRNA-transfected cells for validation of protein depletion (right panel). (L) HeLa cells were infected with S. Typhimurium MOI of 10 for 6 h. (M) Relative fold change in mRNA level of autophagy receptors in uninfected and S. Typhimurium-infected HeLa cells were analyzed by RT-qPCR. UI, uninfected; Sal, S. Typhimurium.
