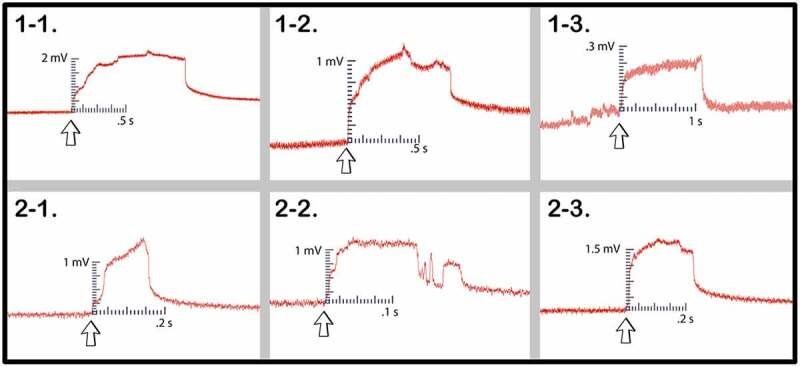
Figure 9.

Wound responses conducted across the bridge for cucumber trials 1 and 2.This figure depicts the electrical responses that were conducted from one cucumber plant to another via rhyzoelectric pathways for the six setups. The scale values on the x-axis are in seconds and the scale values on the y-axis are in millivolts. The arrows indicate the moment of induction.
