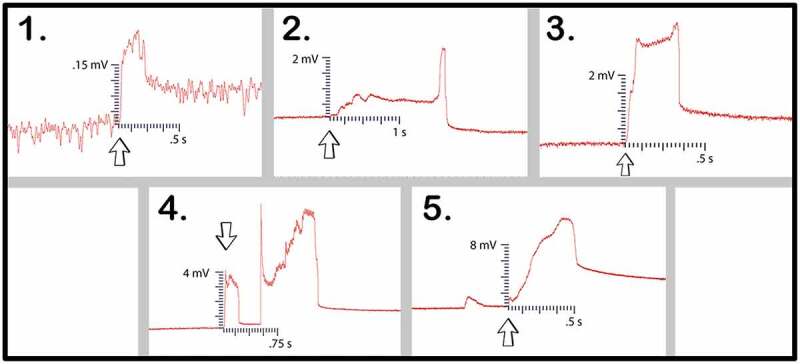
Figure 10.

Pea trial 1 signal propagations. This figure depicts the 5 electrical responses that were recorded from one pea plant to another via rhyzoelectric pathways. The scale values on the x-axis are in seconds and the scale values on the y-axis are in millivolts. In setup 4, the change in electric potential and duration of smaller response was used in the table as this was the initial response. The arrows indicate the moment of induction.
