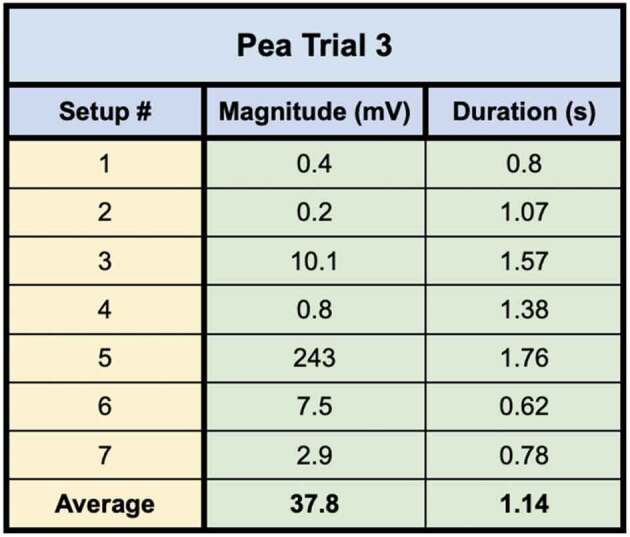
Table 4.
This table depicts the magnitude and duration of the wound responses conducted from Side B to Side A for Pea Trial 3. For complex responses, the area under the curve was taken to average the magnitude of the response.
 |
This table depicts the magnitude and duration of the wound responses conducted from Side B to Side A for Pea Trial 3. For complex responses, the area under the curve was taken to average the magnitude of the response.
 |