
Figure 2.
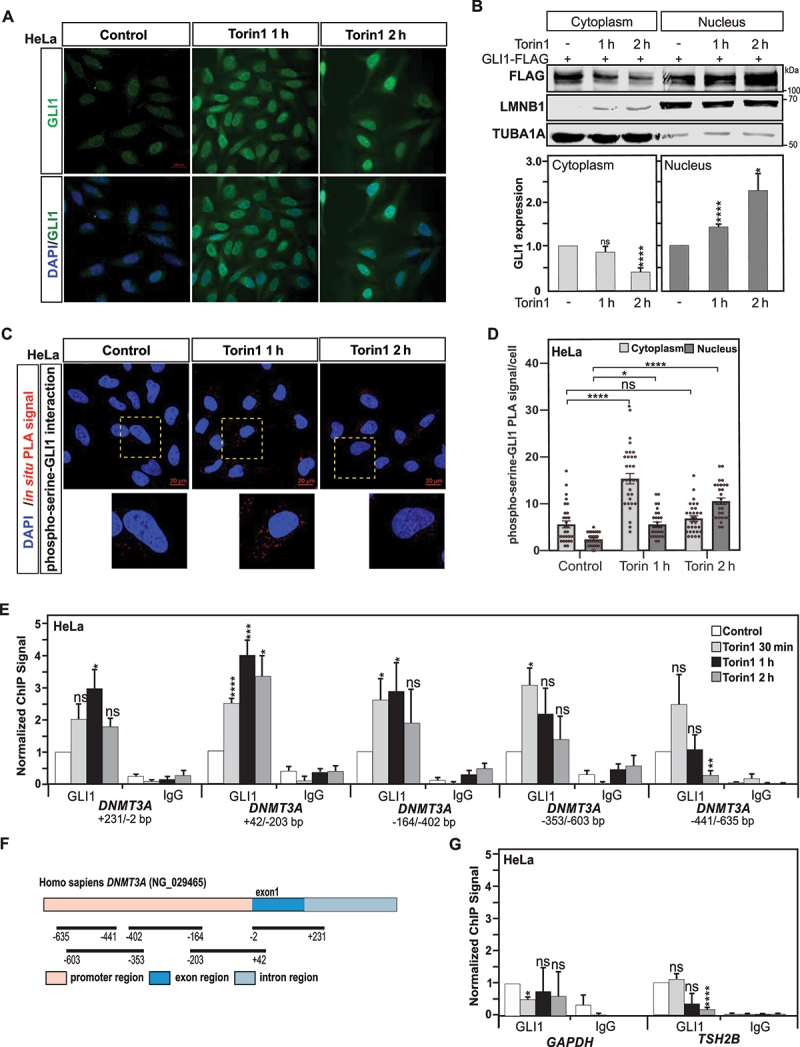
GLI1 translocates to the nucleus and is recruited to DNMT3A promoter upon autophagy induction. (A) Representative immunofluorescence confocal images for GLI1, using DAPI for nuclear counterstaining, show that GLI1 is upregulated and displays a nuclear accumulation after 1- and 2-h treatment with Torin1 in HeLa cells. Scale: 100 µm. (B) Immunoblot analysis of the cytoplasmic and nuclear cell extracts from GLI1-Flag transfected HeLa cells confirmed GLI1 nuclear accumulation upon autophagy induction after Torin1 treatment for 1 and 2 h. (C) Phosphorylation of GLI1 at serine residues was assayed by in situ proximity ligation assay (PLA) in HeLa cells treated with Torin1 for 1 or 2 h Nuclear counterstaining with DAPI was used to evaluate nuclear versus cytoplasmic localization of the phospho-serine-GLI1 interactions. Scale: 20 µm. (D) Quantification of the in situ PLA experiments displayed in panel C. Statistics were performed with a one-way ANOVA (Pairwise Multiple Comparison by the Holm-Sidak method), n = 30 and 95% confidence intervals are shown. (E) Chromatin immunoprecipitation (ChIP) analysis of GLI1 recruitment at different DNMT3A promoter and exon 1 regions show GLI1 enrichment upon induction of autophagy with Torin1 treatment in HeLa cells. (F) Schematic representation of regions within promoter and exon 1 of DNMT3A locus analyzed for GLI1 ChIP (localization of regions are indicated in base pairs (bp) in relation to the transcription start site (TSS). (G) No significant GLI1 enrichments were observed at GAPDH and TSH2B loci used as GLI1-nonbinding regions and negative controls. All values are means of at least 3 independent experiments ± SEM and considered significant for *p < 0,05, **p < 0,01, ***p < 0,001 and ****p < 0,0001. n.s, not significant for the indicated comparison. (A, n = 3; B, n = 3; C-D, n = 3; E and G, n = 4).