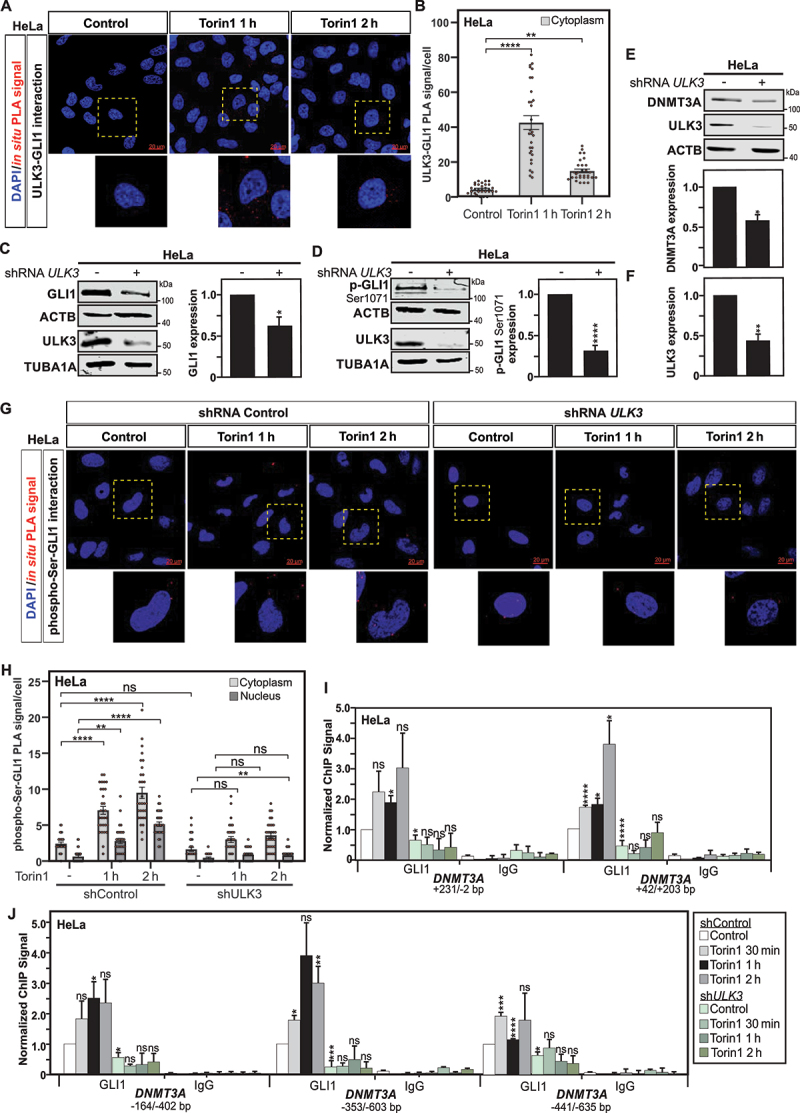
Figure 3.

ULK3 mediates GLI1 activation and phosphorylation. (A) in situ PLA assay reveals protein interaction between ULK3 and GLI1 in HeLa cells treated with Torin1 for 1 or 2 h. DAPI was used for nuclear counterstaining. Scale: 20 µm. (B) Quantification of the in situ PLA experiments displayed in panel A. Statistics were performed with a one-way ANOVA (Pairwise Multiple Comparison by the Holm-Sidak method), n = 30 and 95% confidence intervals are shown. (C) Immunoblot analysis and quantification of GLI1 and ULK3 expression show reduced expression for both proteins in shRNA ULK3 transduced HeLa cells as compared to shRNA control transduced ones. ACTB and TUBA1A were used as loading controls for GLI1 and ULK3, respectively. The graph shows the quantification for GLI1 versus ACTB expression. Under the same conditions, immunoblot analyses and quantifications of p-GLI1 Ser1071 (D) and DNMT3A (E), both normalized with ACTB expression, illustrate decreased GLI1 phosphorylation as well as DNMT3A expression levels in shRNA ULK3 HeLa cells, as compared to shRNA control cells, respectively. (F) Quantification of ULK3 confirms the successful repression of ULK3 expression in HeLa transduced shRNA ULK3 as compared to cells transduced with shRNA control. (G) Analysis of phosphorylation of GLI1 at serine residues by in situ PLA revealed reduced GLI1 phosphorylation as well as nuclear localization in Torin1 treated shRNA ULK3 transduced HeLa cells as compared to their shRNA control transduced counterpart. Nuclear counterstaining with DAPI was used to evaluate nuclear versus cytoplasmic localization of the phospho-serine-GLI1 interactions. Scale: 20 µm. (H) Quantification of phospho-serine and GLI1 interactions per cell of experiments displayed in panel G. Statistics were performed using two-way ANOVA for multiple comparisons between treatments and both cell types. n = 30 and 95% confidence intervals are shown. (I-J) Analysis of GLI1 recruitment to DNMT3A promoter and exon 1 regions by ChIP reveals an absence of GLI1 enrichment at DNMT3A locus in shRNA ULK3 HeLa cells upon Torin1 treatment, as compared to shRNA control HeLa cells where significant GLI1 recruitment is observed upon autophagy induction. GLI1 ChIP for the GAPDH and TSH2B loci used as negative controls are depicted in supplementary figure S3 panel A. All values are means of at least 3 independent experiments ± SEM and considered significant for *p < 0,05, **p < 0,01, ***p < 0,001 and ****p < 0,0001. n.s, not significant for the indicated comparison. (A, n = 3; C-D, n = 3; E and G, n = 4).
