
Figure 4.
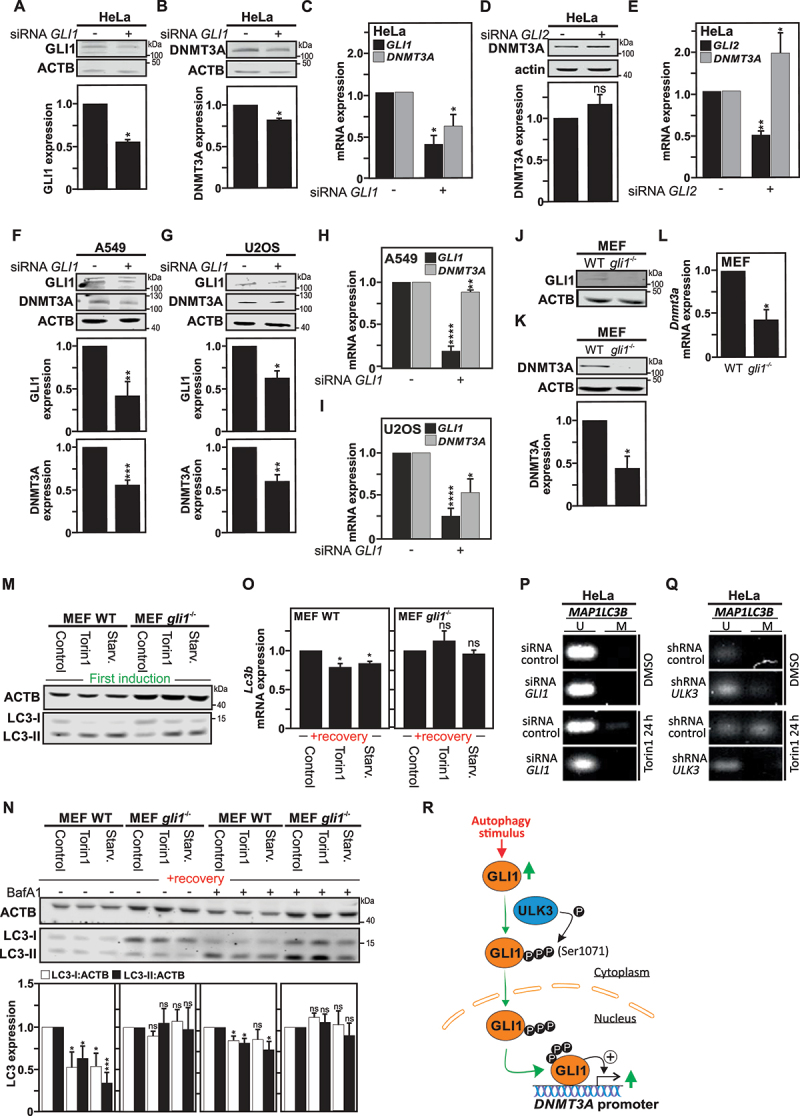
Gli1 regulates DNMT3A expression. Immunoblot analysis and quantification of GLI1 (A) and DNMT3A (B), both normalized with ACTB expression, show reduced expression for both proteins in HeLa cells transfected with GLI1 siRNAs pools. (C) Under the same conditions, RT-qPCR analysis demonstrates reduced GLI1 mRNA and DNMT3A mRNA expression in HeLa cells transfected with GLI1 siRNAs pool. (D-E) Transfection of HeLa cells with GLI2 siRNAs pool, despite being efficient in reducing GLI2 mRNA expression was unable to reproduce the effects observed with GLI1 siRNAs pool on DNMT3A expression. Immunoblot analyses (F-G) and RTqPCR analysis (H-I) and their quantifications, show similar reduction in DNMT3A expression at both protein and mRNA levels in (F, H) A549 cells and (G, I) U2OS cells transfected with the GLI1 siRNAs pool. (J-L) likewise, gli1−/− MEF cells, deficient for GLI1 expression (J) exhibit reduced DNMT3A protein (assayed by immunoblotting, K), as well as Dnmt3a mRNA (assayed by RT-qPCR, L) levels as compared to WT MEF cells. (M) Immunoblot analysis for LC3-I and LC3-II expression upon either Torin1 treatment or starvation (EBSS medium) for 4 h shows occurrence of autophagy in gli1−/− and WT MEF cells as illustrated by an increase of LC3-II levels. (N) Immunoblot analysis of LC3-I and LC3-II expression in both WT and gli1−/− MEF cells either starved, treated with Torin1, or DMSO (used as control) for 4 h, thereafter, left to recover for 1 week and treated 4 h with BafA1 before harvest, showing decreased LC3 expression in WT MEF cells previously exposed to autophagy stimuli, but not in the gli1−/− MEF cells. The graph shows the quantification of LC3-I and LC3-II versus actin expression. (O) Reduced MAP1LC3B mRNA expression measured by RT-qPCR in previously autophagy-exposed WT as compared to gli1−/− MEF cells after 1 week recovery period. Methylation-specific (MS)-PCR analysis of DNA methylation level at MAP1LC3B locus in HeLa cells transfected either with siRNA control or siRNA GLI1 (P) or either with shRNA control or shRNA ULK3 (Q) treated with Torin1 for 24 h, compared with cells treated with DMSO (used as control). (R) Schematic illustration showing that autophagy induction leads to ULK3/GLI1 interaction, which promotes GLI1 activation and translocation into the nucleus. In the nucleus, GLI1 recruitment to DNMT3A promoter regions, promotes DNMT3A upregulation. All values are means of at least 3 independent experiments ± SEM and considered significant for *p < 0,05, **p < 0,01, ***p < 0,001 and ****p < 0,0001. n.s, not significant for the indicated comparison. (A-L, n = 3; M-O, n = 4; P-Q, n = 3).