

ABSTRACT
Centrosome amplification is a phenomenon frequently observed in human cancers, so centrosome depletion has been proposed as a therapeutic strategy. However, despite being afflicted with a lack of centrosomes, many cancer cells can still proliferate, implying there are impediments to adopting centrosome depletion as a treatment strategy. Here, we show that TFEB- and TFE3-dependent autophagy activation contributes to acentrosomal cancer proliferation. Our biochemical analyses uncover that both TFEB and TFE3 are novel PLK4 (polo like kinase 4) substrates. Centrosome depletion inactivates PLK4, resulting in TFEB and TFE3 dephosphorylation and subsequent promotion of TFEB and TFE3 nuclear translocation and transcriptional activation of autophagy- and lysosome-related genes. A combination of centrosome depletion and inhibition of the TFEB-TFE3 autophagy-lysosome pathway induced strongly anti-proliferative effects in cancer cells. Thus, our findings point to a new strategy for combating cancer.
Abbreviations: AdCre: adenoviral Cre recombinase; AdLuc: adenoviral luciferase; ATG5: autophagy related 5; CQ: chloroquine; DAPI: 4’,6-diamidino-2-phenylindole; DKO: double knockout; GFP: green fluorescent protein; KO: knockout; LAMP1: lysosomal associated membrane protein 1; LAMP2: lysosomal associated membrane protein 2; LTR: LysoTracker Red; MAP1LC3B/LC3B: microtubule associated protein 1 light chain 3 beta; MITF: melanocyte inducing transcription factor; PLK4: polo like kinase 4; RFP: red fluorescent protein; SASS6: SAS-6 centriolar assembly protein; STIL: STIL centriolar assembly protein; TFEB: transcription factor EB; TFEBΔNLS: TFEB lacking a nuclear localization signal; TFE3: transcription factor binding to IGHM enhancer 3; TP53/p53: tumor protein p53
KEYWORDS: Anti-cancer therapy, autophagy, centrosome, lysosomal biogenesis, PLK4, transcription factor E3, transcription factor EB
Introduction
The centrosome is comprised of two centrioles surrounded by the pericentriolar material (PCM) [1,2]. The PCM contains many proteins responsible for microtubule nucleation and anchoring, enabling the centrosome to act as the microtubule-organizing center to regulate many microtubule-related cellular functions [3,4]. Furthermore, the centrosome is known to seed the formation of the primary cilium, which is a hair-like projection that protrudes from cells and acts as a sensor to transduce extracellular signals into intracellular responses [5]. Significantly, centrosome dysfunction has been implicated in various human diseases, so it is of great importance to further explore and understand the functions and underlying regulatory mechanisms of this organelle [6,7].
Centrosome duplication is tightly coupled with cell-cycle progression in order to ensure normal cell division. In the G1 phase of the cell cycle, each cell contains two centrioles, termed the “mother” and the “daughter” centriole. During the G1/S transition, new centrioles assemble right next to these preexisting centrioles via a mechanism dependent on PLK4 (polo like kinase 4) [7]. PLK4 is a serine-threonine protein kinase that plays a critical role in ensuring correct centrosomal assembly and duplication by interacting with and phosphorylating centrosomal proteins [8–14]. Centriole elongation continues in the S and G2 phases until the newly formed centrioles reach their final lengths, resulting in a total of four centrioles. Upon mitotic entry, the two pairs of duplicated centrioles separate to opposite sides of the cell and connect to the spindles, thus, enabling the two duplicated centrioles to be segregated equally into the two daughter cells upon completion of cell division [15]. This process is disrupted by centrosome depletion, which has been shown to prolong mitosis and to result in cell-cycle arrest or cell death [16]. Genome-wide CRISPR-Cas9 knockout screens have revealed that centrosome depletion irreversibly arrests normal cells in a senescence-like G1 state via a TP53/p53-dependent mechanism mediated by USP28 and TP53BP1 proteins [17–20]. In contrast, centrosome amplification usually leads to abnormal cell division and results in supernumerary centrosomes linked to aneuploidy and genomic instability, both hallmarks of cancer [21]. Moreover, aberrant PLK4 expression has also been reported in various human cancers [22,23]. Together, these studies indicate that blocking of centriole duplication by means of PLK4 inactivation to deplete centrosomes may represent an attractive anti-cancer strategy. However, many cancer cells have been reported to continue progressing even after centrosome loss, indicating that cancer cells may activate a survival pathway in order to support acentrosomal proliferation [20].
Macroautophagy, hereafter referred to as autophagy, is a lysosome-dependent and self-degradative cellular mechanism that is crucial for maintaining energy balance during the developmental process and in cellular stress responses [24,25]. A central characteristic of autophagy is the formation and expansion of the phagophore, and, upon engulfing cytoplasmic materials, the formation of a double-membrane vesicle, the autophagosome. In the late stage of autophagy, these autophagosomes ultimately fuse with lysosomes to form autolysosomes, allowing lysosome-derived hydrolytic enzymes to degrade the materials engulfed by the autophagosomes [26]. Membrane trafficking proteins such as LAMP2 (lysosomal associated membrane protein 2) and RAB7A participate in the docking and fusion of autophagosomes with lysosomes. Autophagy operates at a constitutively low level to ensure turnover of organelles and long-lived proteins, representing an important feature contributing to cell metabolism and homeostasis. When cells respond to stress, autophagy is frequently upregulated to prevent immediately cell death, highlighting that autophagy activation is an important mechanism for cellular stress responses [27,28]. Autophagy has also been linked to tumor formation and malignancy [29,30]. Studies on autophagy-deficient mice support that impaired autophagy promotes tumorigenesis [31]. Once tumors have formed, the role of autophagy in tumors could be cytotoxic or cytoprotective, and this is dependent on the types of cancer [30,32]. Accordingly, deciphering the role of autophagy for each tumor context is an important issue when targeting autophagy as an anti-cancer strategy.
Autophagy activation is typically associated with enhanced lysosome biogenesis since the hydrolytic enzymes of lysosomes are required to degrade the materials engulfed by autophagosomes. TFEB (transcription factor EB) and TFE3 (transcription factor binding to IGHM enhancer 3) are master transcriptional regulators of autophagy and lysosomal biogenesis [33,34]. They belong to the microphthalmia/transcription factor E (MiT/TFE) family of transcription factors that also includes MITF (melanocyte inducing transcription factor) and TFEC (transcription factor EC) [35]. Activity of MiT/TFE proteins is primarily controlled according to their subcellular localization, which is regulated by phosphorylation [36–38]. For example, phosphorylation of specific serine residues in TFEB by MTOR (mechanistic target of rapamycin kinase) complex 1 (MTORC1), as well as other kinases, restricts TFEB to the cytoplasm. However, in response to a variety of stimuli, TFEB can be dephosphorylated and transported from the cytosol into the nucleus [39,40]. This translocation of TFEB subsequently activates multiple genes required for autophagosome formation, autophagosome-lysosome fusion, and lysosomal cargo degradation via directly binding to specific E-box sites within the promoters of target genes [33,34].
In this study, we identify TFEB and TFE3 as novel PLK4 substrates and reveal that phosphorylation of both transcription factors by PLK4 sequesters TFEB and TFE3 to the cytosol, thereby inhibiting their transcriptional activation. Centrosome loss inactivates PLK4 and induces TFEB and TFE3 dephosphorylation, thereby triggering TFEB and TFE3 to undergo translocation to the nucleus where they can activate autophagy and lysosome biogenesis. We also report that the increased autophagic activity attributable to TFEB and TFE3 dephosphorylation is required for centrosome loss-induced G1 arrest in normal cells and acentrosomal proliferation in cancer cells. Thus, our findings reveal a potential strategy for improving the anti-cancer effects of centrosome depletion.
Results
Centrosome loss induces vacuole accumulation in the peri-nuclear area
To understand cellular responses to centrosome depletion, we treated cells with centrinone, the high specificity of cell permeable PLK4 inhibitor, to induce centrosome loss [41]. We first confirmed the efficacy of centrosome depletion by means of TUBG1/γ-tubulin staining (Fig. S1A). SASS6 and STIL proteins are known to be degraded by the proteasome-mediated degradation in the G1 phase of the cell cycle [42,43]. The western blot (WB) analysis showed that centrinone treatment decreased the levels of SASS6 and STIL, which indicated most of cells were in the G1 state (Fig. S1B). Phase-contrast imaging showed that centrinone-treated cells frequently displayed an abnormal accumulation of vacuoles in the peri-nuclear area (Figure 1A,B and Fig. S1C,D). Vacuole size varied among cells, ranging from 1 to 5 μm (Figure 1A and Fig. S1C). To confirm that abnormally vacuole formation was caused by centrosome loss, we induced acentrosomal cells by adding Adenoviral Cre recombinase (AdCre) to PLK4flox/neoflox cells [44], and observed that those cells still displayed the abnormal phenotype (Figure 1C-E). Two acentrosomal cell lines (SASS6 TP53 DKO and STIL TP53 DKO RPE1 cells) were then generated and used to assess changes in cellular vacuole formation in the absence of centrosomes (Figure 1F) [16,45]. In comparison to control (TP53 KO) cells, both SASS6 TP53 DKO and STIL TP53 DKO RPE1 cells displayed vacuole accumulation, confirming that the abnormally vacuole induction was a consequence of centrosome loss (Figure 1G,H).
Figure 1.
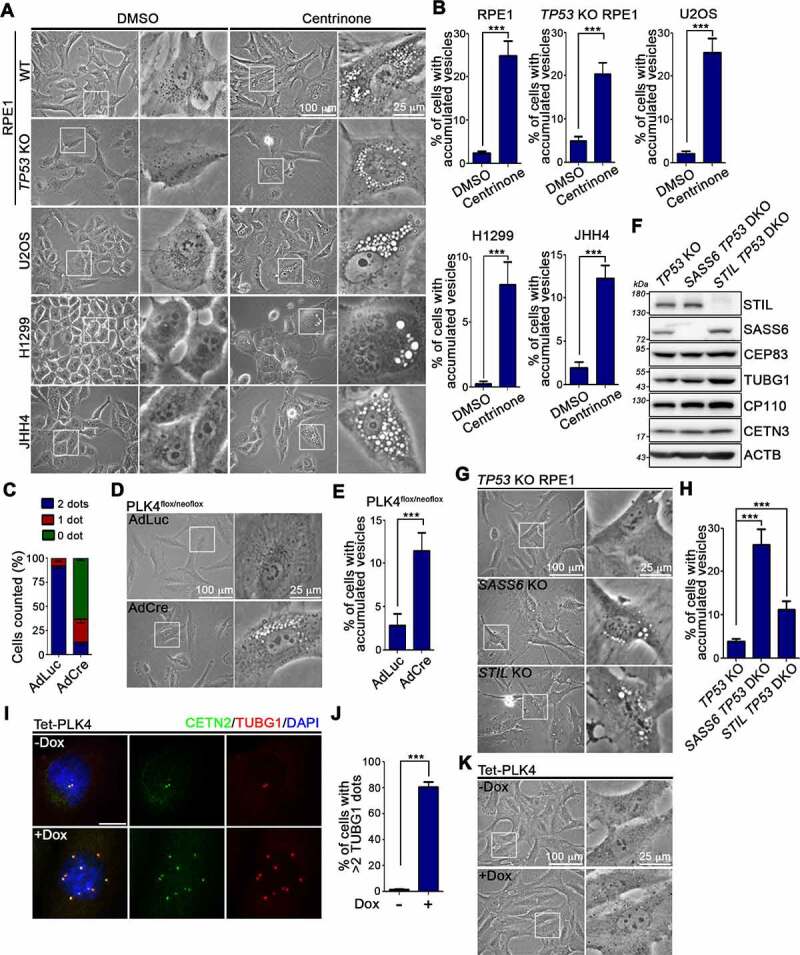
Centrosome loss induces vesicle accumulation within cells. (A) Cells were treated with DMSO or centrinone for 4 days and then performed phase-contrast imaging. Regions within the marked boxes were magnified in right to highlight the changes. Scale bars are as indicated. (B) Percentage of cells showing abnormally vacuole accumulation was quantified. (C) PLK4flox/neoflox cells were infected with AdLuc or AdCre for 4 days. Centrosome number was counted by TUBG1 staining. (D) AdLuc- or AdCre-infected PLK4flox/neoflox cells were cultured for 4 days. Images were taken by phase-contrast light microscope. Regions within the marked boxes were magnified in right. Scale bars are as indicated. (E) Percentage of cells showing abnormally vacuole accumulation from (D) was quantified. (F) WB analysis of the control (TP53 KO) and two acentrosome (SASS6 TP53 DKO and STIL TP53 DKO) RPE1 cells was performed using antibodies as indicated. (G) Phase-contrast imaging of the TP53 KO, SASS6 TP53 DKO, and STIL TP53 DKO RPE1 cells. Regions within the marked boxes were magnified in right. Scale bars are as indicated. (H) Percentage of cells showing vacuole accumulation was quantified. (I) Cells were treated with doxycycline (1 μg/ml) for 4 days. Cells were fixed followed by staining with indicated antibodies. Nuclei were stained with DAPI (blue). Scale bar: 25 μm. (J) The percentage of cells showing more than 2 TUBG1 foci was quantified. (K) Images from (I) were taken by phase-contrast light microscope. Regions within the marked boxes were magnified in right. Scale bars are as indicated. In (B), (C), (E), (H), and (J), at least 200 cells from n = 3 independent experiments were tested. Error bars represent the mean ± SEM. *** P < 0.001 by Student’s t test.
Centrosome loss is known to trigger TP53/p53-dependent growth arrest in cells [16]. To examine the role of p53 in our observation of centrosome loss-induced vacuole formation, TP53 knockout cells were treated with centrinone to induce centrosome loss. Centrinone treatment resulted in vacuole accumulation within both TP53 knockout RPE1 and HCT116 cells, indicating that p53 is unlikely to mediate abnormally vacuole formation arising from centrosome loss (Figure 1A,B and Fig. S1C,D). Further investigation of RPE1 cells expressing PLK4 under control of a doxycycline-inducible promoter allowed us to examine vacuoles in cells with amplified centrosomes (Figure 1I,J). However, doxycycline-inducible PLK4 expression did not induce abnormally vacuole formation, supporting that the accumulation of vacuoles within cells represents a cellular response that is specifically induced by centrosome loss (Figure 1K).
Centrosome loss enhances lysosome biogenesis
To characterize the mechanism underlying centrosome loss-induced vacuole formation, we adopted a stable isotope labeling by amino acids in cell culture (SILAC)-based quantitative proteomics approach to measure protein changes in cells after undergoing centrosome loss (see Materials and Methods for details; Figure 2A) [46]. Our proteome analysis revealed that centrosome loss led to an universal increase in lysosomal proteins in RPE1 cells (Figure 2B and Table S1). Here, LAMP1 (lysosomal associated membrane protein 1) and LAMP2 (lysosomal associated membrane protein 2) were used to analyze the state of the lysosomes in centrosome-depauperate cells. Compared to DMSO-treated RPE1 cells, RPE1 cells treated with centrinone exhibited increases in LAMP1 and LAMP2 signals, suggesting that centrosome loss enhanced lysosomal numbers in RPE1 cells (Figure 2C and Fig. S2A). Centrinone treatment also increased the levels of LAMP1 and LAMP2 in U2OS cells, which indicated the phenotype of lysosomal number-increased upon centrosome loss could be observed in non-transformed and cancer cells (Figure 2C and Fig. S2A). We noted that the LAMP1 and LAMP2 signals localized to the membranes of accumulated vacuoles, indicating that the abnormally formed vacuoles were lysosomes (Figure 2C and Fig. S2A). WB analysis of LAMP1 and LAMP2 expression further confirmed that centrosome loss enhanced lysosomal amounts (Figure 2D). The influence of centrosome loss in endosomes was also examined. WB analysis showed that the centrinone treatment slightly increased the level of endosome marker EEA1, which supports the effect of centrosome loss has a more significant impact on lysosomes (Figure 2D and Fig. S2C).
Figure 2.
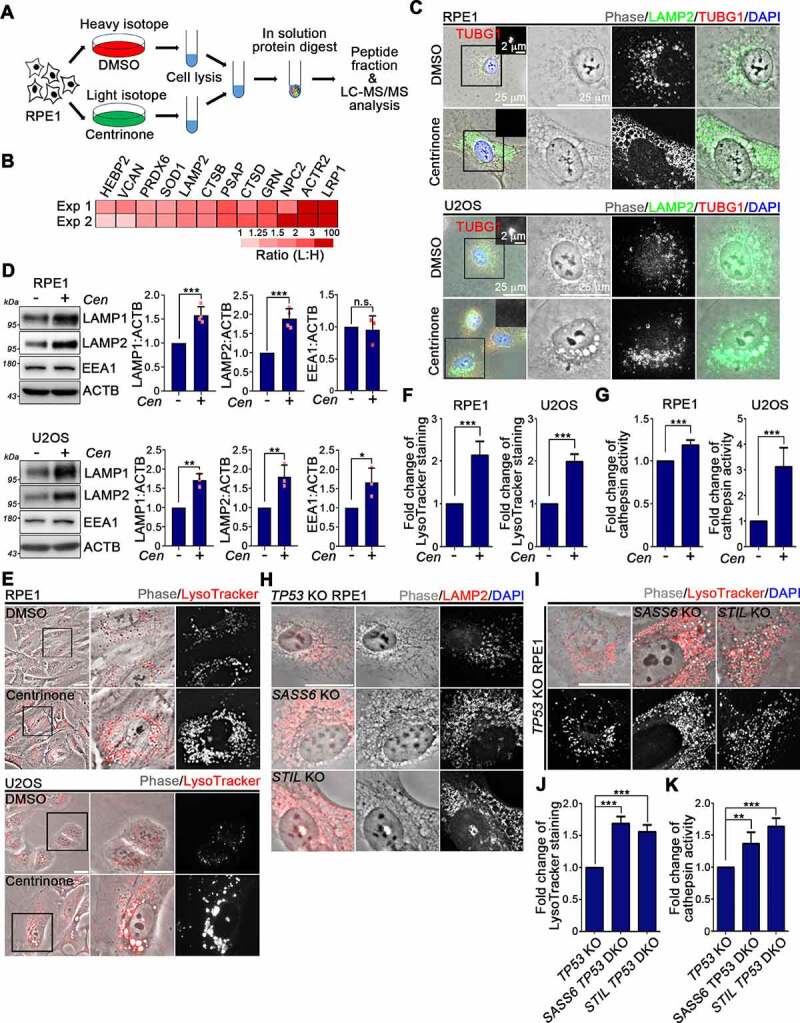
Centrosome loss enhances lysosome biogenesis. (A) Experimental workflow of SILAC-based proteomic analysis. (B) Heatmap shows lysosomal proteins that were identified in the screen from two independent experiments (Exp 1 and Exp 2). (C) Cells were treated with DMSO or centrinone for 4 days followed by immunostaining using anti-LAMP2 (green) and anti-TUBG1 (red) antibodies. Regions within the marked boxes were magnified for clarity. Scale bars are as indicated. (D) Cells were treated with DMSO or centrinone (Cen) for 4 days. The levels of LAMP1, LAMP2, and EEA1 were analyzed by WB analyses. Band intensities were quantified using ImageJ software. Data were collected from at least three independent experiments. Error bars represent the mean ± SD. n.s. not significant, *** P < 0.001, ** P < 0.01, * P < 0.05 by Student’s t test. (E) Cells were treated with DMSO or centrinone for 4 days followed by loading with LysoTracker Red dye for 30 min before imaging. Regions within the marked boxed were cropped and magnified in the right. Scale bar: 25 μm. (F) The relatively fluorescent intensities of LysoTracker signals from (E) were quantified. (G) Lysosomal activity was measured by performing Z-FR-AMC cleavage assay. (H) Cells were stained with the anti-LAMP2 antibody. Scale bar: 25 μm. (I) LysoTracker Red was loaded in cells for 30 min before imaging. Scale bar: 25 μm. (J) The fluorescent intensities of LysoTracker signals from (I) were quantified. (K) Lysosomal activity was measured by performing Z-FR-AMC cleavage assay. In (F) (G), (J), and (K), three independent experiments were tested. Error bars represent the mean ± SEM. *** P < 0.001, ** P < 0.01 by Student’s t test.
Next, we examined the effects of centrosome loss on lysosomal function. To do so, we loaded LysoTracker Red (LTR) into cells treated with DMSO or centrinone to evaluate the effect of centrosome loss on the acidity of lysosomal compartments. Compared to DMSO-treated cells, centrinone-treated cells exhibited significantly enhanced LTR signal, indicating that centrosome loss increases both lysosomal number and activity (Figure 2E,F). We further monitored lysosome proteolytic activity by performing dye quenched-bovine serum albumin (DQ-BSA) and cathepsin activity assays. Compared to DMSO-treated cells, centrinone-treated cells displayed a high dequenching propensity of DQ-BSA and enhanced cathepsin activity, indicating intracellular proteolytic activity elevated upon centrosome loss (Figure 2G and Fig. S2B). Centrinone treatment of TP53 knockout RPE1 cells also resulted in an increase of LAMP1 and LAMP2 levels, indicating that p53 is not involved in regulating lysosomal biogenesis arising from centrosome loss (Fig. S2C). SASS6 TP53 DKO and STIL TP53 DKO cells, as well as AdCre-treated PLK4flox/neoflox cells, all displayed increases in lysosome numbers and activity, further confirming that centrosome depletion elevates the catabolic activity of lysosomes (Figure 2H-K and Fig. S2D-G). Since PLK4 overexpression did not affect the levels of LAMP1 and LAMP2, as well as LTR signal, it confirms that these increases in lysosome numbers and activity are specifically attributable to centrosome loss (Fig. S2H,I). Together, these results indicate that centrosome loss enhances lysosome biogenesis.
Centrosome loss leads to autophagy activation
We then hypothesized that centrosome loss-enhanced lysosome biogenesis could be a result of autophagy activation. We observed a punctate staining pattern for LC3 (an autophagosome marker), reflecting that centrinone treatment enhanced both the size and number of autophagosomes within cells (Figure 3A). WB analysis of the LC3-II:LC3-I ratio was then used to estimate autophagosome abundance. Compared to DMSO-treated cells, cells treated with centrinone possessed a higher LC3-II:LC3-I ratio, reflecting higher amounts of phosphatidylethanolamine (PE)-conjugated LC3, consistent with the increased numbers of autophagosomes (Figure 3B). Moreover, relative to their respective controls, more LC3 puncta were detected in SASS6 TP53 DKO, STIL TP53 DKO, and AdCre-treated PLK4flox/neoflox cells, confirming that centrosome loss promotes autophagosome formation (Figure 3C-F). SQSTM1/p62 is an autophagy substrate frequently adopted as a reporter for autophagy. A reduction in SQSTM1 level upon centrinone treatment indicated that centrosome loss activated autophagy (Figure 3B). Ultrastructural analysis of SASS6 TP53 DKO and STIL TP53 DKO RPE1 cells by means of transmission electron microscopy confirmed the presence of both autophagosomes and enlarged lysosomes that had engulfed partially undigested materials (Figure 3G and Fig. S3A,B).
Figure 3.
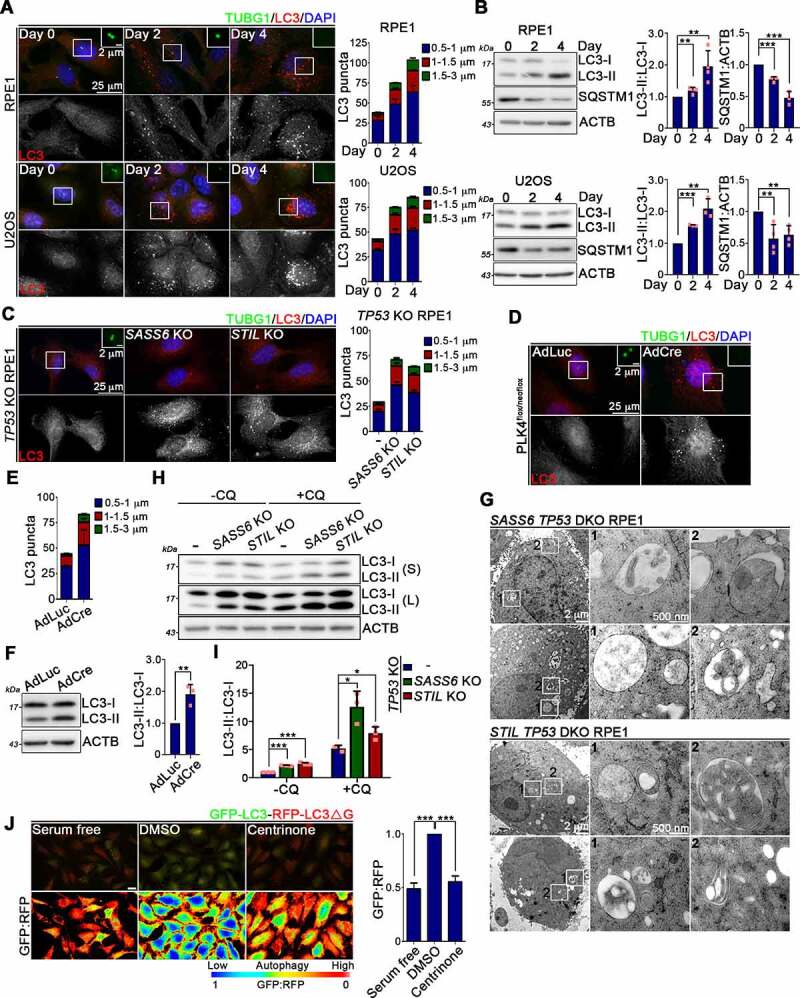
Centrosome loss leads to autophagy activation. (A) RPE1 and U2OS cells were treated with DMSO or centrinone and stained with antibodies as indicated. Regions within the marked boxes were magnified for clarity. Nuclei were stained with DAPI. Scale bars are as indicated. The size and number of LC3 puncta were quantified and shown in the right. (B) WB analysis was performed to examine the levels of LC3 and SQSTM1/p62 with ACTB as the loading control. The fold changes of LC3-II to LC3-I ratio and SQSTM1/p62 levels were quantified. (C) Cells were fixed and processed for immunofluorescence with anti-TUBG1 (green) and anti-LC3 (red) antibodies. Nuclei were stained with DAPI. The representative images were shown. Scale bars are as indicated. Graph represents the size and number of LC3 puncta per cell. (D) PLK4flox/neoflox cells were infected with AdLuc or AdCre for 4 days. Cells were fixed and stained with antibodies as indicated. Regions within the marked boxes were magnified for clarity. Nuclei were stained with DAPI. Scale bars are as indicated. (E) Graph represents the size and number of LC3 puncta per cell. (F) WB analysis was performed to examine LC3 level in AdLuc- or AdCre-treated cells. ACTB was served here as the loading control. The LC3-II to LC3-I ratio was quantified and shown in the right. (G) Representative TEM u-ltrastructural images of SASS6 TP53 DKO and STIL TP53 DKO cells. Regions within the marked boxed were magnified and shown in the right. Scale bars are as indicated. (H) Cells were treated with or without chloroquine (CQ) for 16 h followed by WB analysis using antibodies as indicated. S: short exposure. L: long exposure. (I) Band intensities were measured using ImageJ software. (J) DMSO or centrinone was treated in cells stably expressed GFP-LC3-RFP-LC3ΔG for 4 days. For serum free experiment, cells were serum starved for 24 h. Cells were directly visualized under fluorescence microscopy. The GFP:RFP ratiometric comparison was also shown. Scale bar: 25 μm. The quantification of the GFP:RFP ratio was shown in the right. In (A), (C), (E), and (J), at least 200 cells were analyzed per experiment. Data were collected from three independent experiments. Error bars represent the mean ± SEM. *** P < 0.001 by Student’s t test. In (B), (F), and (I), data were collected from at least three independent experiments. Error bars represent the mean ± SD. *** P < 0.001, ** P < 0.01, * P < 0.05 by Student’s t test.
The observed increase in numbers of autophagosomes could potentially be a consequence of promoted autophagosome formation or, alternatively, blockage of autophagosome-lysosome fusion. Chloroquine (CQ) treatment of SASS6 TP53 DKO and STIL TP53 DKO RPE1 cells resulted in a markedly increased LC3-II:LC3-I ratio, supporting that centrosome loss enhances autophagic flux rather than blocks autophagic degradation (Figure 3H,I). We also used a fluorescent probe, GFP-LC3-RFP-LC3ΔG, to directly quantify autophagic flux by measuring the decrease in green fluorescent protein (GFP) signal relative to that of red fluorescent protein (RFP) signal [47]. Centrosome loss was induced in RPE1 and PLK4flox/neoflox cells that stably expressed GFP-LC3-RFP-LC3ΔG. Compared to their respective controls, centrosome loss resulted in a significantly decreased GFP:RFP ratio in both cell types, further confirming that centrosome loss enhances autophagic flux (Figure 3J and Fig. S3C,D). We also explored the potential involvement of p53 in regulating centrosome loss-induced autophagy. Centrinone treatment of TP53 KO cells elevated the punctate staining pattern of LC3, as well as the LC3-II:LC3-I ratio, as revealed by immunostaining and WBs (Fig. S3E-G). Centrinone treatment also reduced the GFP:RFP ratio in TP53 KO cells stably expressing GFP-LC3-RFP-LC3ΔG, confirming that p53 does not contribute to centrosome loss-induced autophagy (Fig. S3H,I). Hence, our data support that centrosomes play a regulatory role in autophagy.
Centrosome loss leads to TFEB nuclear translocation and transcriptional activation
Next, we investigated if the autophagy promotion and enhanced lysosome biogenesis due to centrosome loss required the aid of TFEB, a master transcription factor that is known to control autophagy and lysosome biogenesis [38]. To do so, TFEB-GFP was ectopically expressed in U2OS cells and then subjected to DMSO or centrinone treatment for indicated days. Subsequent assay of the subcellular localization of TFEB-GFP revealed that the application of centrinone treatment for 2 days resulted in a striking redistribution of TFEB-GFP from the cytosol into the nucleus and the phenomenon could last for 4 days (Figure 4A,B). Immunostaining of endogenous TFEB further confirmed that centrinone treatment induced TFEB nuclear translocation (Figure 4C). Similar observations were made when performing the subcellular fractionation assay. TFEB translocated into the nucleus upon centrinone treatment, as shown by the positive TFEB signal in the nuclear fraction, which was absent in DMSO-treated control cells (Figure 4D). To determine the potential impact of centrosome loss on transcriptional activation of TFEB, we conducted chromatin immunoprecipitation coupled with quantitative PCR (ChIP-qPCR) in centrinone-treated cells expressing HA-tagged TFEB, which revealed TFEB enhancement at the promoters of autophagy- and lysosome-associated genes relative to DMSO-treated control cells (Figure 4E). The qPCR analysis to measure expression levels of TFEB target genes revealed that centrinone treatment induced a global increase in mRNA levels of TFEB target genes (Figure 4F and Fig. S4A) [48]. Moreover, WB analysis confirmed that centrosome loss enhanced the expression of proteins required for autophagy activation and lysosome biogenesis (Figure 2D, 4G,H and Fig. S4B,C). Together, our results reveal that centrosome loss promotes TFEB nuclear translocation and transcriptional activation.
Figure 4.
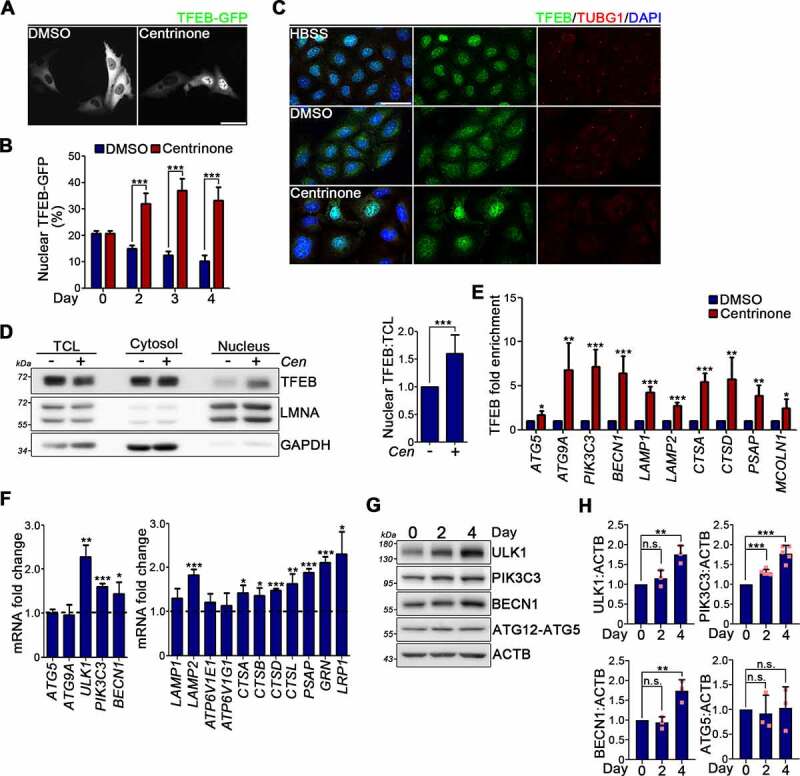
Centrosome loss promotes TFEB nuclear translocation. (A) TFEB-GFP was transiently expressed in U2OS cells following DMSO or centrinone treatment for indicated days. The subcellular distribution of TFEB-GFP was seen directly under microscopy. Scale bar: 50 μm. (B) Quantification of TFEB-GFP in the nucleus was shown. More than 150 cells were analyzed per experiment. Data were collected from three independent experiments. Error bars represent the mean ± SEM. *** P < 0.001 by Student’s t test. (C) U2OS cells were treated with DMSO or centrinone for 4 days. For HBSS experiment, cells were treated with HBSS buffer for 2 h. Cells were fixed and stained with antibodies as indicated. Scale bar: 50 μm. (D) Cells were subjected to nuclear and cytosolic fractionation followed by WB analysis with antibodies as indicated. LMNA and GAPDH was used as nuclear and cytosolic marker, respectively. TCL: total cell lysate. The nuclear:TCL ratio of TFEB from the immunoblots was quantified. (E) HA-TFEB-expressing cells were treated with DMSO or centrinone for 4 days. TFEB-ChIP-qPCR analysis was performed to analyze the binding of TFEB at its target genes. The increased folds of TFEB at those genes were quantified by normalizing the centrinone-treated samples to DMSO-treated controls. (F) U2OS cells were treated with DMSO or centrinone for 4 days. The expression of TFEB target genes was analyzed by qPCR analysis. Data were normalized to an internal control (RPL19) and plotted as fold change induction above DMSO arbitrarily set as 1. In (E) and (F), error bars represent the mean ± S.D. from at least three independent experiments. *** P < 0.001, ** P < 0.01, * P < 0.05 by Student’s t test. (G) U2OS cells were treated with centrinone for different days. Cell lysate described above was analyzed by WB analysis using antibodies as indicated. (H) Band intensities from (G) were quantified. In (D) and (H), data were from three independent experiments. Error bars represent the mean ± SD. n.s. not significant, *** P < 0.001, ** P < 0.01 by Student’s t test.
TFEB regulates centrosome loss-induced autophagy and lysosome biogenesis
Two different TFEB short hairpin RNAs (shRNAs) were chosen to inhibit TFEB expression in RPE1 cells. The efficient TFEB knockdown was confirmed by means of WB analysis (Figure 5A). Compared to control cells, TFEB knockdown in RPE1 cells significantly impaired centrinone treatment-induced autophagy, as reflected by the punctate staining signal of LC3 and the GFP:RFP ratio in GFP-LC3-RFP-LC3ΔG-expressing cells (Figure 5B-E). To further consolidate the notion that TFEB is involved in regulating centrosome loss-induced autophagy, we generated TFEB KO U2OS cells (Fig. S5A). Notably, the increased levels of LC3-II, LAMP1, and LAMP2, as well as abnormally vacuole formation, that typically arised from centrosome loss were diminished upon TFEB depletion, as revealed by immunoblotting and phase-contrast imaging (Fig. S5). Wild-type (WT) TFEB was then reintroduced into the TFEB KO cells, where renewed expression of TFEB rescued centrosome loss-induced autophagy, lysosome biogenesis, and abnormally vacuole formation (Figure 5F-K). Cytoplasmic-to-nuclear TFEB translocation is the principle mechanism underlying how TFEB activity is regulated. TFEB lacking a nuclear localization signal (TFEBΔNLS) was also re-expressed in TFEB KO U2OS cells (Figure 5F). Unlike in WT TFEB-expressing cells, centrinone treatment no longer promoted TFEB nuclear translocation in TFEBΔNLS-expressing cells nor did it induce autophagy activation, or increased lysosome biogenesis in those cells, indicating that TFEB mediates the elevated autophagy and lysosome biogenesis attributable to centrosomal loss (Figure 5G-J, 6I, and Fig. S6G). We would also like to know whether TFEB nuclear translocation plays an important role in regulating centrosome loss-induced abnormally vacoule formation. Compared to the WT TFEB-expressing cells, centrinone treatment didn’t induce abnormally vacuole formation in TFEBΔNLS-expressing cells, indicating that functions as a results of centrosome loss are carried out through TFEB nuclear translocation to accumulate vacuoles within cells (Figure 5K).
Figure 5.
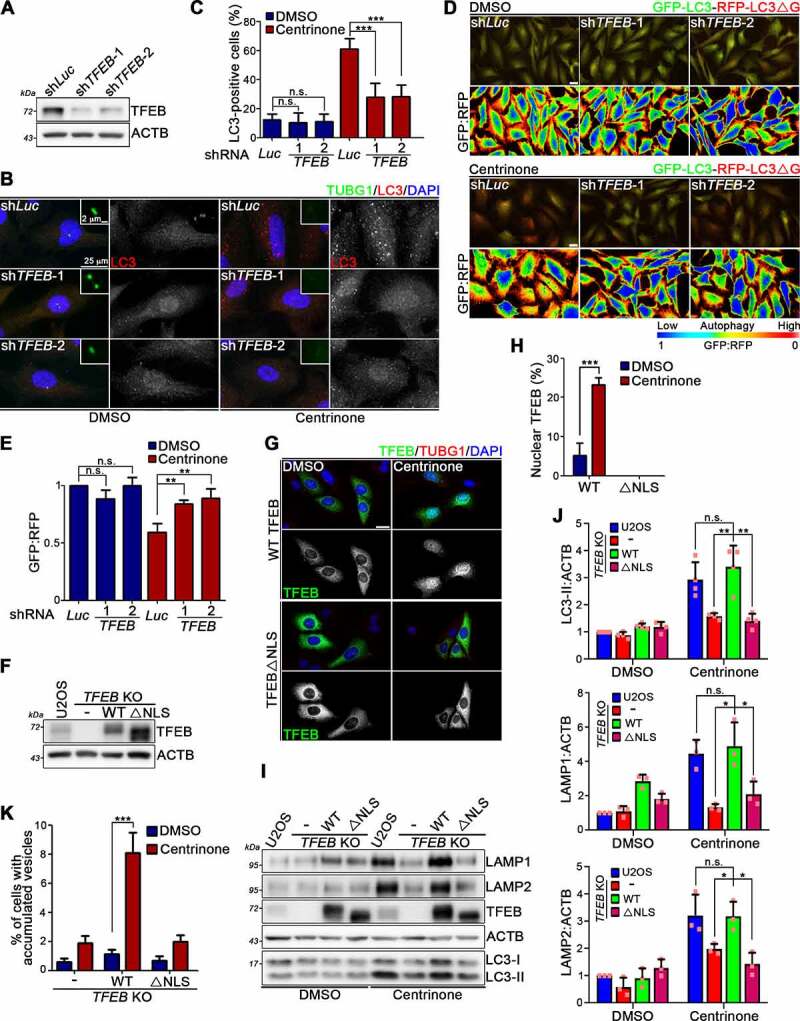
TFEB is involved in regulating centrosome loss-induced autophagy and lysosome biogenesis. (A) RPE1 cells were infected with lentivirus carrying luciferase or TFEB shRNAs followed by treating with DMSO or centrinone for additional 4 days. The TFEB levels were examined by WB analysis with ACTB as the loading control. (B) RPE1 cells were infected with lentivirus carrying luciferase or TFEB shRNAs followed by DMSO or centrinone treatment for 4 days. Cells were fixed and stained with antibodies as indicated. Typical images were presented. Scale bars: 25 μm. (C) The percentage of cells showing more than 30 LC3 puncta (diameter from 1 to 3 μm) per cell was quantified. (D) GFP-LC3-RFP-LC3ΔG-expressing RPE1 cells were infected with lentivirus carrying luciferase or TFEB shRNAs followed by DMSO or centrinone treatment for 4 days. Cells were visualized under fluorescent microscopy. The GFP:RFP ratiometric comparison was also shown. Scale bar: 25 μm. (E) The GFP:RFP ratio from (D) was quantified. (F) WT TFEB and its NLS mutant (TFEBΔNLS) were stably expressed in TFEB KO U2OS cells. WB analysis was performed with anti-TFEB and anti-ACTB antibodies. (G) Cells were treated with DMSO or centrinone for 4 days and stained with antibodies as indicated. Nuclei were stained withDAPI. Scale bar: 25 μm. (H) Quantification of TFEB signals in the nucleus from (G) was shown. (I) WB analyses were performed to examine the levels of LAMP1, LAMP2, TFEB, and LC3. ACTB was used here as the internal control. (J) Band intensities of LC3-II, LAMP1, and LAMP2 were quantified using ImageJ software. Data were collected from at least three independent experiments. Error bars represent the mean ± SD. n.s. not significant, ** P < 0.01, * P < 0.05 by Student’s t test. (K) Percentage of cells showing abnormally vesicle accumulation was quantified. In (C), (E), (H) and (K), at least 200 cells from n = 3 independent experiments were tested. Error bars represent the mean ± SEM. n.s. not significant, *** P < 0.001 by Student’s t test.
TFEB activation is impaired by PLK4-mediated phosphorylation at Ser459
TFEB nuclear translocation is mainly driven by its phosphorylation status. To test if centrosome loss affects TFEB phosphorylation, WT TFEB- and TFEBΔNLS-expressing cells were treated with centrinone to induce centrosome loss and then examined TFEB phosphorylation. Phosphorylation of both WT TFEB and TFEBΔNLS markedly decreased following exposure to centrinone, which indicated that centrosome loss promoted TFEB dephosphorylation. Moreover, that dephosphorylation occurred prior to TFEB being translocated into the nucleus (Figure 6A,B and Fig. S6B-D). Next, we carried out a centrosome fractionation analysis on U2OS cells to assess if TFEB is a component of centrosomes. WB analysis revealed that TFEB was detected in the major peak of TUBG1 fractions, supporting that some TFEB localizes to centrosomes (Fig. S6A). Therefore, we hypothesized that PLK4 phosphorylates centrosomally localized TFEB, resulting in its cytoplasmic retention in an inactive state. We first looked at whether complexes between PLK4 and TFEB could be detected. Flag-tagged PLK4 was ectopically expressed in cells that stably expressed HA-TFEB. Our result showed that TFEB could be detected in PLK4 immunocomplex (Fig. S6E). To validate that PLK4 phosphorylates TFEB, WT PLK4 and its catalytically-inactive mutant (PLK4 KD) were transiently expressed in cells stably expressing HA-TFEB. Notably, ectopically expressed WT PLK4, but not PLK4 KD, significantly promoted TFEB phosphorylation, evidencing that TFEB is a PLK4 substrate (Figure 6C). Based on in silico GPS-Polo prediction, Ser401, Ser459, and Ser467 represent potential PLK4-mediated phosphorylation sites on TFEB. We mutated each of these residues individually to alanine and then expressed the resulting TFEB mutant proteins in TFEB KO cells. Unlike for TFEBS401A and TFEBS467A, ectopic expression of PLK4 did not promote TFEBS459A phosphorylation, indicating that PLK4 phosphorylates TFEB at Ser459 (Figure 6D and Fig. S6F). Further investigation by means of subcellular localization analysis showed that TFEBS459A mainly localized in the nucleus, confirming that phosphorylation of TFEB at Ser459 by PLK4 prevents TFEB nuclear translocation (Figure 6E). Because AKT was reported previously to phosphorylate TFEB at Ser467 [49], we predicted that TFEBS467A would localize in the nucleus. Indeed, a subcellular localization analysis confirmed a diminished cytosolic localization for TFEBS467A (Figure 6E). To examine how TFEB phosphorylation at Ser459 might control centrosome loss-induced autophagy, we generated a TFEB phosphomimetic mutant in which the PLK4 phosphorylation site was substituted with aspartate (TFEBS459D). TFEBS459D was re-introduced in TFEB KO cells before subjecting them to centrinone treatment to induce centrosome loss. Compared to WT TFEB, centrinone treatment did not promote TFEBS459D nuclear translocation, indicating TFEB nuclear translocation promoted by centrosome loss is caused by TFEB dephosphorylation at Ser459 (Figure 6F). Moreover, WB analysis showed that centrinone treatment of TFEBS459D-expressing cells no longer resulted in increased levels of LC3-II, LAMP1, LAMP2, or in LTR signal, confirming a crucial role for TFEB phosphorylation at Ser459 in regulating centrosome loss-induced autophagy and lysosome biogenesis (Figure 6G-I and Fig. S6G). Together, these results indicate that centrosome loss results in TFEB dephosphorylation at Ser459, thereby promoting TFEB nuclear translocation and subsequent activation of autophagy and lysosome biogenesis.
Figure 6.
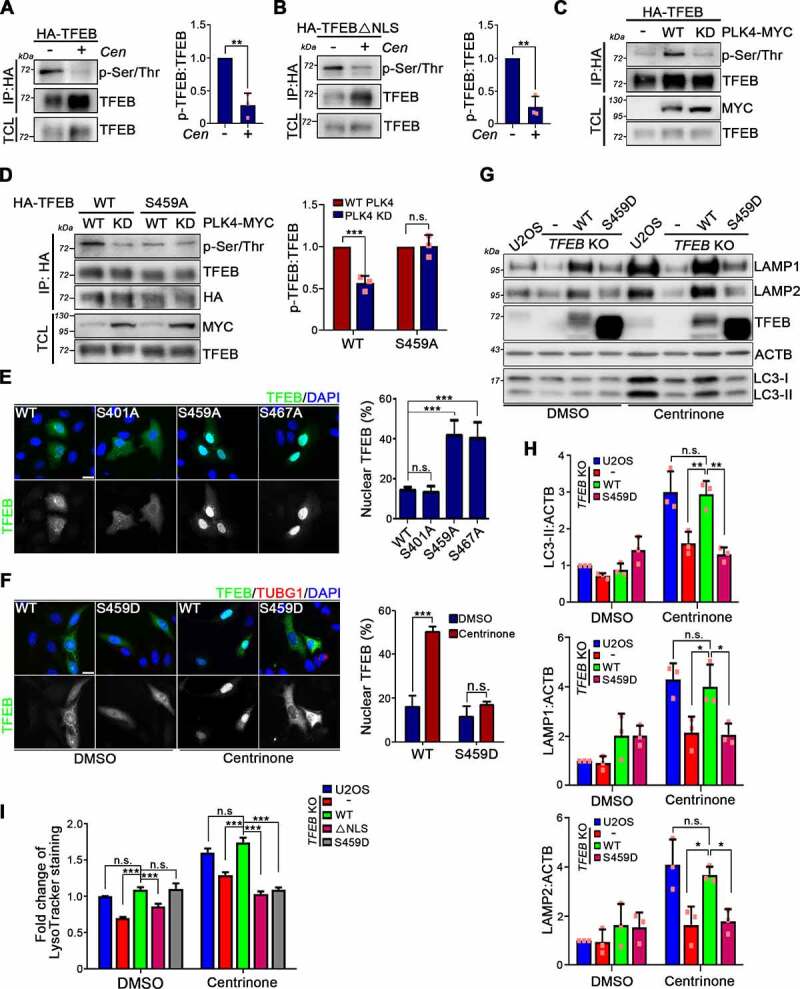
Phosphorylation of TFEB by PLK4 prevents TFEB activation. (A and B) HA-tagged WT TFEB (A) and TFEBΔNLS (B) were stably expressed in TFEB KO U2OS cells. Cells were treated with DMSO or centrinone (Cen) for 3 days. Anti-HA IP assay was performed to pull down HA-tagged WT TFEB and TFEBΔNLS followed by WB analyses with antibodies as indicated. TFEB phosphorylation was quantified and shown in the right. (C) WT PLK4 and PLK4 KD were ectopically expressed in HA-TFEB-expressing cells. Anti-HA IP assay was performed to pull down HA-TFEB followed by WB analyses with antibodies as indicated. (D) WT PLK4 and PLK4 KD were ectopically expressed in cells that stably expressed HA-tagged WT TFEB or TFEBS459A. Anti-HA IP assay was performed to pull down HA-TFEB followed by WB with antibodies as indicated. The levels of WT TFEB and TFEBS459A phosphorylation were quantified and shown in the right. (E) HA-tagged WT TFEB, TFEBS401A, TFEBS459A, and TFEBS467A were transiently expressed in TFEB KO U2OS cell followed by TFEB staining. DAPI staining indicates the nucleus. Scale bar: 25 μm. The percentage of cells that showed nucleus-localized TFEB was quantified. (F) HA-tagged WT TFEB and TFEBS459D were stably expressed in TFEB KO U2OS. Cells were treated with DMSO or centrinone for 4 days. TFEB subcellular localization was analyzed. DAPI staining indicates the nucleus. Scale bar: 25 μm. The percentage of cells that showed nucleus-localized TFEB was quantified. (G) WB analysis was performed with antibodies as indicated. (H) Band intensities of LC3-II, LAMP1, and LAMP2 from (G) were quantified. (I) DMSO or centrinone was treated in HA-tagged WT TFEB, TFEBΔNLS, and TFEBS459D-expressing cells for 4 days. LysoTracker Red was loaded into cells for 30 min before imaging. The fluorescent intensities of LysoTracker were quantified. In (A), (B), (D), and (H), data were from three independent experiments. Error bars represent the mean ± SD. n.s. not significant, *** P < 0.001, ** P < 0.01, * P < 0.05 by Student’s t test. In (E), (F), and (I), at least 200 cells from n = 3 independent experiments were tested. Error bars represent the mean ± SEM. n.s. not significant, *** P < 0.001 by Student’s t test.
Prevention of TFE3 activation by PLK4-mediated phosphorylation at Ser560
Alignment of TFEB sequences from multiple species shows that the serine residue 459 is evolutionarily conserved (Figure 7A). Intriguingly, this residue is conserved in TFE3 and MITF, other members of the microphthalmia/transcription factor E (MiT/TFE) family of transcription factors (Figure 7B). To explore if centrosome loss also induces nuclear translocation of TFE3 and MITF, HA-tagged TFE3 and MITF were expressed in U2OS cells and then cells were subjected to centrinone treatment. In contrast to MITF, centrinone treatment resulted in a robust accumulation of TFE3 in the nucleus, indicating that centrosome loss also induces TFE3 nuclear translocation (Figure 7C). A subcellular fractionation assay further confirmed that centrinone treatment promotes TFE3 nuclear translocation (Figure 7D and Fig. S7). To examine if centrosome loss affects TFE3 phosphorylation, we treated TFE3-expressing cells with centrinone and observed a marked decrease of TFE3 phosphorylation, evidencing that centrosome loss causes TFE3 dephosphorylation (Figure 7E). Moreover, ectopic expression of WT PLK4, but not PLK4 KD, significantly promoted TFE3 phosphorylation, indicating that PLK4 is responsible for phosphorylating TFE3 (Figure 7F). Next, we mutated the conserved residue Ser560 in TFE3 to alanine and then ectopically expressed TFE3S560A in U2OS cells. PLK4 overexpression did not promote TFE3S560A phosphorylation, implying that PLK4 phosphorylates TFE3 at Ser560 (Figure 7G). A subsequent subcellular localization analysis showed that TFE3S560A mainly localizes in the nucleus, confirming that phosphorylation of TFE3 at Ser560 prevents its nuclear translocation (Figure 7H). Together, our results indicate that both TFEB and TFE3 represent novel PLK4 substrates and phosphorylation of TFEB and TFE3 by PLK4 prevents their nuclear translocation and transcriptional activation (Figure 7I).
Figure 7.
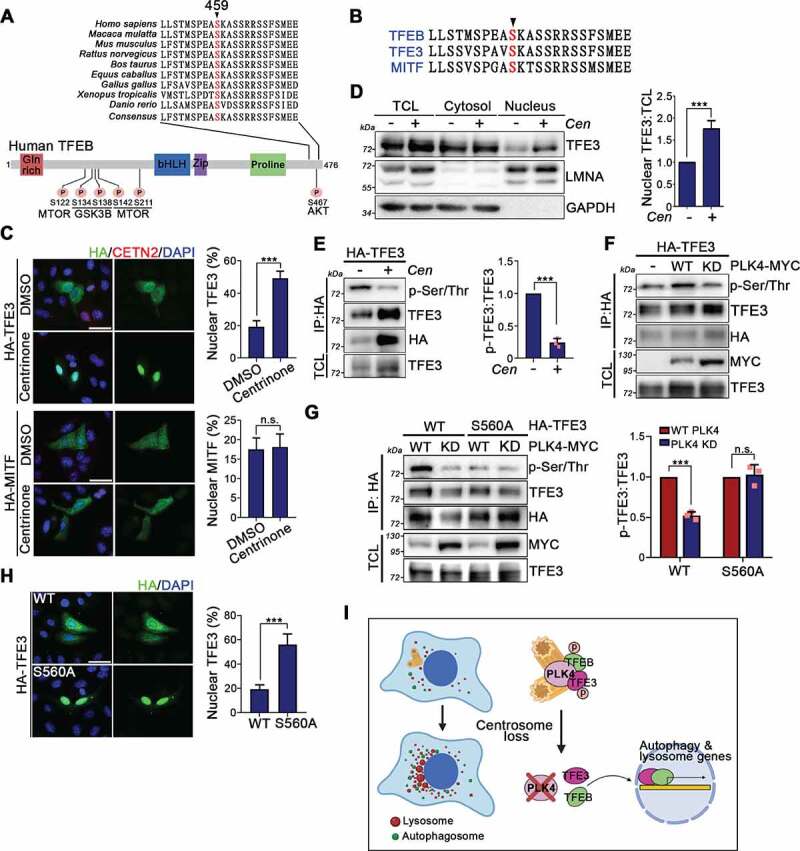
PLK4 phosphorylates TFE3 at Ser560. (A) Sequence alignment of TFEB proteins at C-terminus from the following species. A region surrounding the PLK4 phosphorylation site on human TFEB was magnified here. Position 459 refers to the human TFEB protein sequence. The relevant TFEB phosphorylation sites are also listed. (B) The intra-family sequence alignment of TFEB Ser459 residue. (C) HA-tagged TFE3- and MITF-expressing cells were treated with DMSO or centrinone for 4 days. Cells were fixed and stained with antibodies as indicated. Scale bar: 50 μm. Quantifications of HA-TFE3 and HA-MITF signals in the nucleus were shown. (D) Cells were subjected to nuclear and cytosolic fractionation followed by WB analysis with antibodies as indicated. LMNA and GAPDH was used as nuclear and cytosolic marker, respectively. TCL: total cell lysate. The nuclear:TCL ratio of TFE3 from the immunoblots was quantified. (E) HA-TFE3-expressing cells were treated with DMSO or centrinone (Cen) for 4 days. HA-TFE3 was pulled down and TFE3 phosphorylation was examined. TCL: total cell lysate. The levels of TFE3 phosphorylation were quantified. (F) WT PLK4 and PLK4 KD were ectopically expressed in cells that stably expressed HA-TFE3. Anti-HA IP assay was performed to pull down HA-TFE3 followed by WB analysis to measure TFE3 phosphorylation. (G) WT PLK4 and PLK4 KD were ectopically expressed in cells that stably expressed HA-TFE3 or HA-TFE3S560A. Anti-HA IP assay was performed to pull down HA-TFE3 followed by WB analysis with antibodies as indicated. The levels of WT TFE3 and TFE3S560A phosphorylation were quantified and shown in the right. (H) HA-TFE3 and HA-TFE3S560A were expressed in U2OS cells. Cells were fixed and stained with anti-HA antibody. DNA was stained by DAPI. Scale bar: 50 μm. The percentage of cells showing nuclear TFE3 signal was quantified and shown in the right. In (C) and (H), at least 200 cells for each condition from n = 3 independent experiments were tested. Error bars represent the mean ± SEM. n.s. not significant, *** P < 0.001 by Student’s t test. In (D), (E), and (G), immunoblots were quantified. Error bars represent the mean ± S.D. from at least three independent experiments. n.s. not significant, *** P < 0.001, ** P < 0.01 by Student’s t test. (I) The diagram shows that centrosome loss inactivates PLK4 and results in TFEB and TFE3 dephosphorylation and nuclear translocation to promote autophagy and lysosome biogenesis.
TFEB-dependent autophagy activation is required for centrosome loss-induced cell-cycle arrest in RPE1 cells
We knocked out ATG5 (autoghagy related 5) from RPE1, U2OS, and H1299 cells to study the role of elevated autophagic activity in cellular responses to centrosome loss (Figure 8A). A cell proliferation assay revealed that autophagy inhibition only slightly affected cell growth (Fig. S8). Centrosome loss is known to irreversibly arrests non-transformed cells in a senescence-like G1 state [16]. We treated WT and ATG5 KO RPE1 cells with centrinone to induce centrosome loss and observed that, unlike the control cells, some of the ATG5 KO RPE1 cells became rounded and detached 8 days after the treatment. A cell death assay was thus conducted to determine if centrinone treatment caused cell death in the ATG5 KO RPE1 cells. Indeed, cell death was detected in centrinone-treated ATG5 KO RPE1 cells, supporting that elevated autophagic activity is required for non-tranformed cells to arrest in G1 phase upon centrosome loss (Figure 8B). Moreover, when ATG5 KO PLK4flox/neoflox cells were treated with AdCre to induce centrosome loss, cell death was significantly promoted relative to the control cells, confirming that the elevation in autophagy induced by centrosome loss plays a critical role in the cell-cycle arrest of non-transformed cells (Figure 8C). Chloroquine can be used to inhibit autophagy. Cells treated with a combination of centrinone and chloroquine exhibited enhanced cell death relative to cells treated with centrinone alone, further evidencing the importance of elevated autophagy in centrosome loss-induced cell-cycle arrest (Figure 8D). Furthermore, centrinone treatment also induced cell death in TFEB-knockdown RPE1 cells, demonstrating that TFEB controls centrosome loss-induced cell-cycle arrest in non-transformed cells (Figure 8E).
Figure 8.
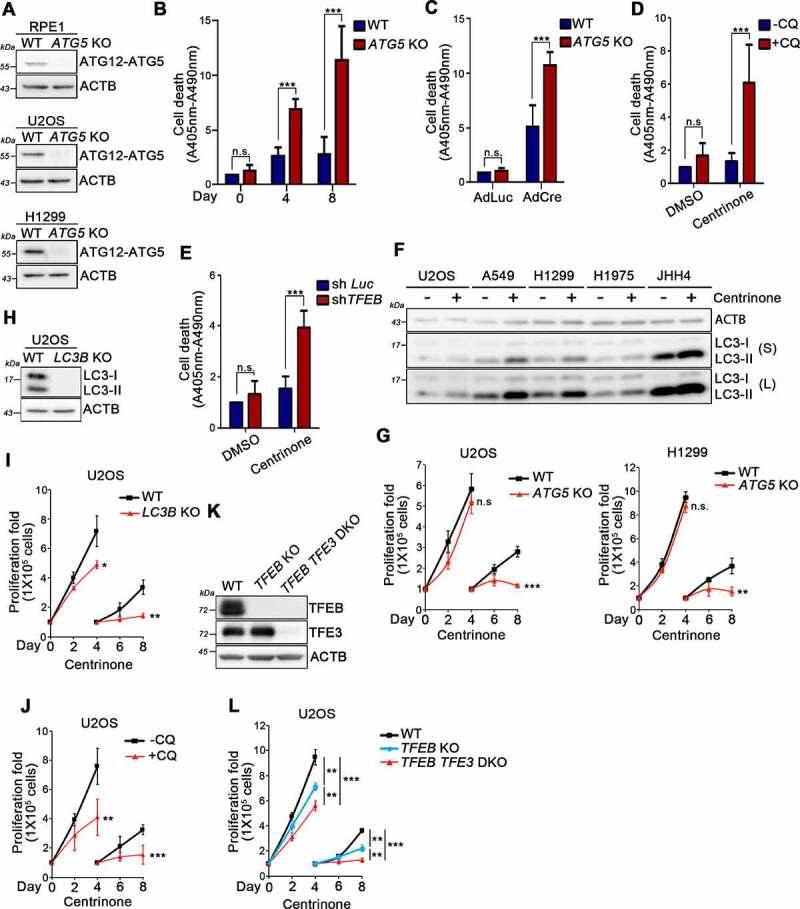
Autophagy is required for centrosome loss-induced cell-cycle arrest in normal cells and supports cancer proliferation in the absence of centrosomes. (A) ATG5 gene was knocked out in RPE1, U2OS, and H1299 cells. WB analysis was performed to confirm the depletion of ATG5 protein. ACTB was used as the loading control. (B) WT and ATG5 KO RPE1 cells were treated with centrinone for indicated days. Cell death was examined. (C) PLK4flox/neoflox cells were infected with AdLuc or AdCre for 8 days and assayed for the cell death. (D) RPE1 cells were treated with centrinone, chloroquine, or their combination for 8 days and assayed for the cell death. (E) Control and TFEB knockdown RPE1 cells were treated with DMSO or centrinone for 8 days and assayed for the cell death. (F) Cancer cells were treated with DMSO or centrinone for 4 days and performed WB analysis to examine LC3-II level. ACTB was served here as the loading control. S: short exposure. L: long exposure. (G) WT and ATG5 KO U2OS and H1299 cells were treated with DMSO or centrinone for indicated days. Cancer cell proliferation was quantified. (H) LC3B gene was knocked out in U2OS cells. WB analysis was performed to confirm the depletion of LC3B protein. ACTB was used as the loading control. (I) WT and LC3B KO U2OS cells were treated with centrinone followed by performing the cell proliferation assay. (J) Cell proliferation assay was performed in U2OS cells treated with centrinone or the combination of centrinone and chloroquine (CQ). (K) WB analysis was performed with indicated antibodies. ACTB was used as the loading control. (L) WT, TFEB KO, and TFEB TFE3 DKO U2OS cells were treated with centrinone followed by performing the cell proliferation assay. In (B), (C), (D), (E), (G), (I), (J), and (L), data were collected from three independent experiments (n = 3). Error bars represent the mean ± SEM. n.s. not significant, * P < 0.05, ** P < 0.01, *** P < 0.001 by Student’s t test.
A combination of centrosome depletion and autophagy inhibition exerts strongly anti-proliferative effects on cancer cells
A WB analysis of LC3 levels showed that centrinone treatment activated autophagy in cancer cells (Figure 8F). To examine the potential impact of elevated autophagy during cancer responses to centrosome loss, we treated ATG5 KO U2OS and ATG5 KO H1299 cancer cells and respective control cells with centrinone. Cell proliferation assays showed that U2OS and H1299 cells displayed a continuously slow proliferation even after centrosome loss (Figure 8G). However, in comparison to their WT cells, centrinone treatment led to a dramatic decrease in cell proliferation in ATG5-depleted U2OS and H1299 cells, indicating that elevated autophagy supports acentrosomal cancer proliferation (Figure 8G). We also generated U2OS cells displaying MAP1LC3B/LC3B gene knockout (a core gene in the autophagy pathway) in which autophagy is inhibited (Figure 8H). Blocked acentrosomal cell proliferation in LC3B KO U2OS cells supports the idea that elevated autophagy is required for cancer growth in the absence of centrosomes (Figure 8I). Moreover, U2OS cells treated with a combination of centrinone and chloroquine exhibited reduced acentrosomal proliferation in comparison to cells treated with centrinone alone, further confirming an important role for elevated autophagy in supporting acentrosomal cancer proliferation (Figure 8J). To investigate if TFEB is involved in regulating acentrosomal cancer proliferation, we treated TFEB KO U2OS cells and a respective control with centrinone and then assessed acentrosomal cell proliferation. Compared to the WT cells, the TFEB KO cells exhibited diminished acentrosomal proliferation (Figure 8L), demonstrating that TFEB regulates this feature of cancer. Since TFEB and TFE3 both are PLK4 substrates, we induced centrosome loss in TFEB and TFE3 double-knockout cells (TFEB TFE3 DKO) to address the significance of TFEB and TFE3 activation during centrosome loss (Figure 8K). Compared to TFEB KO cells, acentrosomal proliferation significantly reduced in TFEB TFE3 DKO cells (Figure 8L), indicating that TFEB and TFE3 function together in controlling cancer proliferation in the absence of centrosomes. Collectively, our results indicate that centrosome loss promotes TFEB- and TFE3-dependent autophagy activation, thereby promoting acentrosomal cancer proliferation.
Discussion
Presently, it remains largely unclear regrading how cancer cells continue to grow slowly even after centrosome loss. Here, we have shown that centrosome loss induced abnormally vacuole formation in the peri-nuclear area and that centrosome depletion activated autophagy. We have also demonstrated that autophagy plays a crucial role in controlling centrosome loss-induced G1 arrest in non-transformed cells, as well as in acentrosomal cancer proliferation. The mechanism underlying this impact of centrosome loss is revealed by our discovery that TFEB and TFE3 are novel PLK4 substrates. Centrosome loss inactivates PLK4, resulting in TFEB and TFE3 dephosphorylation and subsequent transcriptional activation to promote autophagy and lysosome biogenesis.
The significant role of centrosomes in cancer proliferation has been well documented, with centrosome amplification being a general feature of cancer and correlating with advanced tumor grade and poor prognosis [21,50]. Thus, depleting centrosomes by blocking centrosome duplication has been proposed as an attractive strategy for cancer therapy [51]. PLK4 is a critical kinase for centriole duplication, and compounds such as CFI-400945 and centrinone are designed to deplete centrosomes by blocking PLK4 activity [20,52]. A previous study revealed that CFI-400945 treatment presented promising results in terms of cell death and tumor suppression in a xenograft mouse model and it has already been approved for clinical trials [52]. However, other studies have revealed limitations in using PLK4 inhibitors. For instance, many cancer cells still form bipolar spindles during mitosis and their cell cycle can continue in the absence of centrosomes [20]. Accordingly, an intrinsic pathway that supports cancer proliferation appears to be activated upon centrosome loss. Thus, identifying this survival pathway has become an important research goal. Recent studies have shown that acentrosomal spindle assembly following PLK4 inhibition is dependent on expression levels of TRIM37 [53,54]. Low-level TRIM37 abundance results in accelerated acentrosomal spindle assembly, supporting acentrosomal cancer proliferation. Thus, the strategy of using PLK4 inhibitors is appropriate for patients displaying TRIM37 gene amplification, but it is problematic for patients with low TRIM37 levels. Our findings from this study have uncovered that acentrosomal cancer proliferation is also supported by highly elevated autophagy, revealing an alternative anti-cancer strategy involving autophagy inhibitors. It might be worth exploring if combining PLK4 and autophagy inhibitors could be used as an improved anti-cancer treatment. Given that our study has confirmed that centrosome loss-induced autophagy is regulated through TFEB and TFE3 at centrosomes, our data also raise the intriguing possibility of designing targeted inhibitors of TFEB or TFE3 that either prevent TFEB and TFE3 dephosphorylation or their nuclear translocation.
Our results show that centrosome loss results in TFEB and TFE3 dephosphorylation. TFEB and TFE3 activity is primarily dependent on their phosphorylation status. For example, two serine residues in TFEB (Ser142 and Ser211) are known to play critical roles in regulating TFEB activity, which is phosphorylated by lysosome-localized MTORC1 [36,48,55]. When Ser142 and Ser211 of TFEB are phosphorylated, TFEB remains in the cytosol where it is inactive. Phosphorylation of TFEB at Ser211 has also been demonstrated to sequester TFEB in the cytosol by serving as a docking site for binding with YWHA/14-3-3 protein [55]. Here, our results demonstrate that TFEB and TFE3 are both novel substrates of PLK4. PLK4-mediated phosphorylation of TFEB and TFE3 prevents nuclear translocation and transcriptional activation of both proteins. It is also possible that TFEB and TFE3 phosphorylation promotes their binding to 14-3-3, thereby retaining TFEB and TFE3 in the cytosol. Given our discovery that some TFEB and TFE3 localize to centrosomes, whether phosphorylation of TFEB and TFE3 results in binding to centrosomally-localized proteins to prevent nuclear translocation of the transcription factors is an interesting topic for further research. Moreover, since many kinases have been reported to localize to centrosomes, it is possible that other centrosomal kinases function in concert with PLK4 to maintain TFEB and TFE3 phosphorylation and restrict them to the cytosol. It is also possible that centrosome loss activates phosphatases that promote TFEB and TFE3 dephosphorylation, which warrants further study. Moreover, since TFEB and TFE3 are rapidly dephosphorylated and activated under a variety of cellular stresses, establishing if centrosomes function as stress response centers to sense and integrate stress stimuli by controlling TFEB and TFE3 phosphorylation represents an interesting topic for future investigation.
Materials and methods
Cell culture and reagents
U2OS (ATCC, 40,345), JHH-4 (JCRB Cell Bank, 0435), 293A (Thermo Fisher, R70507), 293 FT (Thermo Fisher, R70007), HCT116 (ATCC, CCL-247), A549 (ATCC, CCL-185), and H1299 (ATCC, CRL-5803) cells were cultured in DMEM medium (Thermo Fisher Scientific, 12,800,017) supplemented with 10% FBS and 1% penicillin-streptomycin. H1975 cells were kindly provided by Mei-Yu Chen (National Yang Ming Chiao Tung university) and cultured in RPMI medium (Thermo Fisher Scientific, 31,800,022) supplemented with 10% FBS and 1% penicillin-streptomycin. RPE1 (hTERT-RPE1; ATCC, CRL-4000) were cultured in DMEM/F-12 (1:1) medium (Thermo Fisher Scientific, 12,400,024) supplemented with 10% FBS and 1% penicillin-streptomycin. To generate doxycycline-inducible PLK4 cells, stable clones of RPE1 cells expressing WT PLK4 from the doxycyline-inducible promoter were obtained through in vivo gene delivery using the lentiviral pLVX-Tight-Puro vector. Cells were used to model centrosome amplification after doxycycline (Sigma-Aldrich, D5207) treatment at 1 μg/ml. Centrinone (MedChem Express, LCR-263) was used to deplete centrosomes. Chloroquine (Sigma-Aldrich, C6628) was used to block autophagosome-lysosome fusion. Self-quenched bodipy-conjugated BSA (Thermo Fisher Scientific, D-12051) and LysoTracker Red (Thermo Fisher Scientific, L-7528) were used to analyze lysosomal activity.
Antibodies
Antibodies used in this study include rabbit anti-LC3B (immunofluorescence [IF] 1:3000; western blot [WB] 1:5000; abcam, ab48394), rabbit anti-LAMP1 (IF 1:1000; WB 1:3000; abcam, ab24170), rabbit anti-LAMP2 (IF 1:1000; WB 1:3000; abcam, ab18528), rabbit anti-phospho-(Ser/Thr) (WB 1:1000; abcam, ab17464), rabbit anti-ATG5 (WB 1:3000; Novus Biologicals, NB110-53,818), mouse anti-ACTB (WB 1:5000; Novus Biologicals, NB600-501), rabbit anti-CEP83 (WB 1:1000; Novus Biologicals, NBP1-90,690), rabbit anti-STIL (WB 1:1000; Bethyl laboratories, A302-441A), mouse anti-SASS6 (WB 1:1000; Santa Cruz Biotechnology, sc-81,431), mouse anti-TUBG1 (IF 1:1000; WB 1:1000; Santa Cruz Biotechnology, sc-51,715), mouse anti-EEA1 (WB 1:1000; BD Biosceince, 610,456), mouse anti-CETN2 (IF 1:1000; Millipore, 04–1624), mouse anti-PLK4 (WB 1:500; Millipore, MABC544), rabbit anti-CP110 (WB 1:1000; Proteintech, 12,780-1-AP), rabbit anti-BECN1 (WB 1:3000; Proteintech, 11,306-1-AP), rabbit anti-ULK1 (WB 1:1000; Cell Signaling Technology, 8054), rabbit anti-PIK3C3 (WB 1:1000; Cell Signaling Technology, 4263), rabbit anti-TFEB (IF: 1:500; WB 1:1000; Cell Signaling Technology, 4240), rabbit anti-MITF (WB 1:1000; Cell Signaling Technology, 12,590), rabbit anti-TFE3 (WB 1:1000; Sigma-Aldrich, HPA023881), mouse anti-HA (IF 1:1000; WB 1:1:000; BioLegend, 901,503), rabbit anti-LMNA (WB 1:2500; GeneTex, GTX101127), rabbit anti-SQSTM1/p62 (WB 1:1000; GeneTex, GTX100685), rabbit anti-CETN3 (WB 1:1000; GeneTex, GTX112317), and rabbit anti-GAPDH (WB 1:5000; GeneTex, GTX100118).
SILAC-based quantitative proteomics
RPE1 cells were cultured in SILAC medium that contained 10% dialyzed fetal bovine serum and supplemented with 13C6-L-lysine and 13C6, 15N4-L-arginine (Thermo Fisher Scientific, 89,988 and 89,990) were named as the “heavy” labeling. RPE1 cells were cultured in SILAC medium that contained 10% dialyzed fetal bovine serum and supplemented with unlabeled L-lysine and L-arginine were named as the “light” labeling. In order to make the complete labeling of cellular proteins with heavy labeled amino acids, cells were cultured in heavy medium for at least 8 doubling time. After labeling, RPE1 cells that cultured in light medium were treated with centrinone (250 nM) for 4 days to induce centrosome loss. Cells were then lysed in lysis buffer (8 M urea, 20 mM Tris-HCl, pH 8) with protease inhibitor (Roche, 11,836,170,001). 30 μg lysate from each pool was mixed together and then digested by SMART Digest™ kits (Thermo Fisher Scientific, 60,109–101). The digested sample was then sent for proteomics analysis. Fractionation was performed using Pierce High pH Reversed-Phase Peptide Fractionation Kit (Thermo Fisher Scientific, 84,868). Three fractions were collected based on the affinity of peptides that bind to the hydrophobic resin. Samples were concentrated by C18 Spin Tips (Thermo Scientific, 84,850) and analyzed by microcapillary liquid chromatography-tandem mass spectrometry (LC-MS/MS) using LTQ Orbitrap Velos. Identified peptides were analyzed by Proteome Discoverer™ 2.2 Software. The identified peptides were filtered to fit 0.01 false discovery rates (FDRs), which ensures that protein identifications with 95% confidence (FDRs ≤ 1%). After excluding the contaminants and false positive identification, a total of 542 proteins was identified in our screen that passed the criteria for protein quantitation (Table S2). Normalized SILAC ratios (L:H) were used for subsequent gene ontology analysis. A comparison of the proteins identified in our study revealed that a total of 85 proteins were significantly upregulated upon centrosome loss (L:H ratio >1.25; Student’s t-test, P < 0.05). Those proteins were chosen and sent for gene ontology analysis by Metascape (http://metascape.org).
Plasmids and transient transfection
Human TFEB, MITF, and TFE3 cDNA were directly amplified from U2OS cDNA library and cloned into the pCDNA3.1 vector that fused with HA tag at its N-terminus. TFEBΔNLS mutant was generated by mutating TFEB amino acid 245–248 from arginine to alanine via side-directed mutagenesis. To generate phospho-dead and phospho-mimic TFEB or TFE3, the targeted serine residues on TFEB and TFE3 were replaced by alanine and aspartate, respectively. MYC-tagged PLK4 was obtained directed from OriGene, Inc. (Origene, RC206015). The kinase-dead version of PLK4 (PLK4 KD) was generated by mutating PLK4 amino acid 159 from aspartate to alanine via site-directed mutagenesis. For expression of C-terminal GFP fusion, TFEB gene was amplified by PCR and cloned into the pEGFP vector. The plasmid pMRX-IP-GFP-LC3-RFP-LC3ΔG was kindly provided by Dr. Ruey-Hwa Chen (Academia Sinica). Cells stably expressing GFP-LC3-RFP-LC3ΔG were generated by retrovirus infection followed by selection with puromycin (5 μg/ml) for at least 2 weeks. HA-tagged TFEB was also cloned into pLAS-3 W vector. Cells stably expressing HA-TFEB were generated by lentivirus infection followed by Geneticin/G418 (500 μg/ml; Thermo Fisher Scientific, 10,131,027) selection.
LysoTracker Red staining
Lysosomal localization and activity were monitored using LysoTracker Red (LTR) DND-99 (Thermo Fisher Scientific, L7528) following the manufacturer’s guideline. Prior to the harvest, cells were loaded with 100 ng/ml LTR at 37°C for 30 min. After washing twice with PBS buffer, the fluorescent intensity was directly visualized by an inverted microscope (Carl Zeiss, Axio Vert.A1) with a LD A-Plan 40x (0.55 NA) objective or analyzed by TECAN Infinite 200 PRO using the excitation/emission of 577/590 nm. The fold-change of lysotracker staining was quantified by normalizing the fluorescent intensity to the protein amount and comparing to the control experiment.
DQ-BSA assay
To examine the lysosomal degradation capacity, cells were incubated with 10 μg/ml of DQ-BSA-Red (Thermo Fisher Scientific, D12051) for 16 h at 37°C. After washing, degradation capacity was measured by the red fluorescence signal released due to the degradation of DQ-BSA-Red. The fluorescent intensities were quantified.
Cathepsin activity assay
Cells were treated with DMSO or centrinone (250 nM) for 4 days. Cells (1x10⁶) were collected and re-suspended in 300 μl hypotonic buffer (10 mM HEPES, pH 7.6, 10 mM K-acetate, 1.5 mM Mg-acetate, 2 mM DTT). Cells were first passed through a 25-gauge needle for several times before centrifugation at 7,000 g for 15 min. The supernatant was then collected. For determination of cathepsin activity, 3 μg cell lysates were added into 50 μl assaying buffer (15 mM HEPES, pH 7.6, 130 mM K-acetate, 1.5 mM Mg-acetate, 1.5 mM CaCl2, 1.6 mM DTT, 5 mM ATP) that contained 50 μM Z-FR-AMC (Biotium, 10,201). After incubating in dark for 30 min, the fluorescent signals were measured by TECAN Infinite 200 PRO using excitation/emission of 380/460 nm. The cathepsin activity was acquired by normalizing the fluorescent intensities with their protein amounts and comparing to the control experiment. To document the specificity of the enzymatic substrate cleavage, assays were also performed in the presence of 10 μM E-64 (Sigma-Aldrich, E3132), a known cathepsin inhibitor, which blocks the substrate cleavage.
Lentivirus production and infection
TFEB shRNAs were obtained from the RNAi Core in Academia Sinica (http://rnai.genmed.sinica.edu.tw/index). For virus production, 293 FT cells (5x10⁵) were plated on a 60-mm dish the day before transfection. 1.5 μg pMD.G, 2.5 μg pCMVΔR8.91, and 4 μg pLKO.1-shTFEB constructs were transfected into 293 FT cells using T-Pro NTR II transfection reagent (T-Pro Biotechnology, JT97-N002M). The supernatant that contained viral particles was harvested 72 h after transfection. Virus containing media was passed through a 0.45 μm filter (Sarstedt, 83.1826). For the infection, RPE1 cells (5x10⁵) were seeded onto a 60-mm plate the night before infection and then incubated with viral stock. 2 days after infection, cells were selected in culture medium containing puromycin (5 μg/ml; Sigma-Aldrich, P8833). The targeting sequences of shTFEB are as following: shTFEB-1 5’-GAACAAGTTTGCTGCCCACAT-3’ and shTFEB-2 5’- TGGCAACAGTGCTCCCAATAG-3’.
RNA extraction, cDNA synthesis and qPCR
Total RNA was isolated using the Quick-RNA™ Miniprep Kit (Zymo Research, R1051). Equal amounts of cDNA were synthesized using the RevertAid RT Reverse Transcription Kit (Thermo Fisher Scientific, K1691). The reverse transcription products were amplified in a reaction mixture containing SYBR™ Green PCR Master Mix (Thermo Fisher Scientific, 4,309,155) and 0.5 μM of each primer. The primer sequences for qPCR are listed in Table 1.
Table 1.
qPCR primers used in this study.
| Gene |
Forward primer (5ʹ-3ʹ) |
Reverse primer (5ʹ-3ʹ) |
| LAMP1 | CAGCAGCAATGTTTATGGTG | AGTGTTCTCTTTTCCACAGG |
| LAMP2 | AATGCCACTTGCCTTTATGC | ATAAGTAGATGCTGCCTTGG |
| ATP6V1E1 | TTGCCACCAAAAACGATGTT | AACTTCCTGTTGGCATTTGC |
| ATP6V1G1 | CTGAAATTGAACAGTACCGC | CCAAGAGGTTGTCCAAGACT |
| CTSA | GCCTCAACATCTACAATCTC | ATGCGCACTTTATCCCCTGA |
| CTSB | CCACCATCAAAGAGATCAGA | CAGCAGGATAGCCACCATTA |
| CTSD | ATCCACTGCAAACTGCTGGA | TGCCTCTCCACTTTGACACC |
| CTSL | CCTCAAGGCAATGAAGGCTG | AGCAACAGAATACTTGGGAT |
| PASP | TGCATTCAGATGGTGACTGA | TGCATCATCATCTGGATAGC |
| GRN | TCCGATACCTGCTGCCAACT | AGGCATCTTCTCCAGTCCAG |
| LRP1 | AGCTATGCCAACGAGACCGT | CGATGTCATCCACAAAGTAG |
| NPC2 | AGCTGAGCAAAGGACAGTCT | TGTCTTTTTGGATAGGGCAG |
| ATG5 | CTGCACTGTCCATCTAAGGA | CCATGAGTTTCCGATTGATG |
| ATG9A | ATTTGCTGCTACTGGGAGAT | CACCATGTAGTTCTGGAAAC |
| ULK1 | AGGAAGATGTCTCTGGGTGG | ACGTGCAAGTCAGACAGGTT |
| PIK3C3 | AAGCCTCTTCCTCCACCAAT | GTTTGCATCAACCATCAAGG |
| BECN1 | CGTCACTGAAAATGAGTGTC | CCACTATCT TGCGGTTCTTT |
| RPL19 | GAAATCGCCAATGCCAACTC | TCCTTGGTCTTAGACCTGCG |
Generation of knockout cells
Knockout cells were generated through co-expression of the Cas9 protein with indicated gRNAs using reagents prepared by the Church group [56], which are available from the Addgene (http://www.addgene.org/crispr/church/). The targeted sequences were first cloned into the gRNA vector (Addgene, 41,824) via the Gibson assembly method (New England Biolabs). Knockout cells were obtained through clonal propagation from a single cell. To obtain stable acentrosome cells lacking STIL, the TP53 gene in RPE1 cells was targeted by the CRISPR method prior to targeting STIL gene [45]. A week after STIL inactivation, we confirmed that some cells were devoid of centrosomes. Pure acentrosome cells were subsequently established. PCR products were cloned and sequenced. The targeting sequences for STIL, ATG5, MAP1LC3B/LC3B, TFEB, and TFE3 genes are 5’-GTGTGGAATTTGACTTGCAT-3’ (STIL), 5’-GAGATATGGTTTGAATATGA-3’ (ATG5), 5’-TCAAGCAGCGCCGCACCTTC-3’ (LC3B), 5’-GGTACCTGTCCGAGACCTAT-3” (TFEB), and 5’-GCTGTTGGAGGAGCGCAGGC-3” (TFE3), respectively.
Transmission electron microscopy
Cells were dissociated by trypsinization. After centrifugation, pellets of culture cells were loaded in 200 μm carriers and cryo-fixed using the high-pressure freezing system (Leica Microsystems, EM PACT2) at the pressure 2000–2050 bar. Freeze substitution in anhydrous acetone containing 1% OsO4 and 0.1% uranyl acetate was conducted using a Leica EM AFS2 system. Frozen samples were kept at −90°C for 2 days, followed by −60°C, −20°C, 0°C, each for one day, and then room temperature. After rinsed with acetone for 4 h twice, samples were infiltrated and embedded in Spurr’s resin. Ultrathin sections (70–90 nm) were cut and stained with 5% uranyl acetate in 50% methanol for 20 min, followed by 0.4% lead citrate in 0.1 N NaOH for 6 min. Sections were examined using a FEI Tecnai G2 Spirit TWIN microscope (FEI Company) at 80 KV, and images were obtained with a Gatan Orius CCD camera. Cells that showed autophagosomes (double-layer membranes) and enlarged vacuoles (vacuole diameter > 1 μm, n > 3 per cell) were quantified.
Protein extraction and WB analysis
Cells were lysed by RIPA buffer (50 mM Tris-HCl, pH 7.6, 0.15 mM NaCl, 1% Triton X-100 [Sigma-Aldrich, T9284], 1% sodium deoxycholate [Sigma-Aldrich, D6750], 0.1% SDS) that supplemented with protease inhibitor. Protein concentration was measured by the Bradford assay (Bio-Rad, 5,000,006). Proteins were separated by SDS-PAGE under reducing condition and then transferred to PVDF membranes (GE healthcare Life Science, GE10600023). Membrane blocking was performed by using TBS-T (20 mM Tris-HCl, pH 7.6, 137 mM NaCl, and 0.1% Tween 20 [BioShop Canada, 9005–64-5]) with 5% nonfat milk for 1 h at RT. Incubation of primary antibodies was all performed at 4°C overnight with 5% nonfat milk in TBS-T. After washing three times with TBS-T, membranes were then incubated with HRP-conjugated goat anti-mouse IgG or goat anti-rabbit IgG antibodies (Jackson ImmunoResearch Laboratories, Inc, 115–035-003, 111–035-003). Signals were visualized with ECL substrate and detected by ImageQuant LAS 4000 (GE healthcare life sciences).
Immunoprecipitation
For the examination of TFEB phosphorylation state, HA-tagged TFEB mutants were stably expressed in TFEB KO U2OS cells. Cells were lysed in a buffer that contained 50 mM Tris-HCl, pH 7.6, 0.15 mM NaCl, 0.5% Triton X-100, 0.5% sodium deoxycholate and 0.05% SDS supplemented with protease and phosphatase inhibitors (Roche, 4,693,132,001 and 4,906,837,001). 1 mg cell lysates was then resuspended in 1 ml lysis buffer and incubated with 10 μl HA-conjugated beads (Thermo Fisher Scientific, A2095) for 2 h at 4°C under gentle rotation. Beads were washed several times with TBS buffer (50 mM Tris-HCl, pH 7.4, 150 mM NaCl) to remove the unbound proteins. The pulled down complex was then performed WB analysis.
Immunofluorescence
Cells were grown on 0.1 mg/ml poly-L-lysine-coated coverslips and fixed with either methanol at −20°C for 15 min or 4% paraformaldehyde at room temperature (RT) for 20 min. Slides were incubated with blocking buffer that contained 3% bovine serum albumin (wt/vol) and 0.1% Triton X-100 in PBS for 30 min at RT. Primary antibodies were all diluted in blocking buffer and incubated for 2 h at RT. Alexa Fluor 488- or 594-conjugated goat secondary antibodies were used at 1:500 dilution (Molecular Probes) and incubated for 1 h at RT. DNA was stained by 4′,6-diamidino-2-phenylindole (DAPI; Molecular Probes). Coverslips were mounted on the slides with mounting medium (Thermo Fisher Scientific, P36961). Fluorescent images were acquired on an upright microscope (Carl Zeiss, Axio Imager M2 ApoTome2 system) with a Plan-NEOFLUAR 100x (1.3 NA) or Apochromat 63x (1.4 NA) oil immersion objective and an Axiocam 702 mono charge-coupled device camera. For LysoTracker staining, images were acquired on an inverted microscope (Carl Zeiss, Axio Vert.A1) with a LD A-Plan 40x (0.55 NA) objective. Acquired images were all processed by ZEN software (Carl Zeiss Microscopy) or ImageJ software (National Institutes of Health).
Subcellular fractionation
Cells (3x10⁵) were seeded on a 10-cm dish followed by treating with DMSO or centrinone (250 nM) for 3 days. Cells were re-suspended in 300 μl ice-cold hypotonic buffer (10 mM HEPES, pH 7.6, 10 mM KCl, 0.1 mM EDTA, 0.1 mM EGTA, 1 mM DTT, 0.15% NP-40 [Sigma-Aldrich, TERGITOL™ solution]) and stayed on ice for 10 min prior passing through a 27-gauge needle. After centrifugation at 18,000 g for 5 min at 4°C, the supernatant was collected as cytosolic fraction. The pellet was taken as the nuclear fraction by re-suspending in 300 μl SDS-sample buffer. All buffers used throughout processing contained protease inhibitors. LMNA and GAPDH were used as the control proteins for nuclear and cytoplasmic fractions respectively.
TFEB chromatin immunoprecipitation (ChIP)-qPCR
HA-TFEB was stably expressed in TFEB KO cells. Cells (3x10⁵) were seeded on a 10-cm dish. After 4 days of DMSO or centrinone treatment, cells (4x10⁶) were collected and cross-linked with 5 ml 1% paraformaldehyde (Thermo Fisher Scientific, 5,025,997) on a shaker for 15 min at RT and quenched with 125 mM glycine for 15 min. Cell pellets were suspended in 5 ml cold PBS buffer that contained 2 mM EDTA, followed by centrifugation at 2600 g for 5 min at 4°C to isolate the nuclei. The pellets were then lysed in 400 μl ChIP lysis buffer (0.1% SDS, 10 mM EDTA, 60 mM Tris-HCl, pH 8.1, 1% Triton X-100) supplemented with protease inhibitor. Chromatin was then sonicated twice for 12 cycles (5 s on and 5 s off) on ice. 1200 μl ChIP dilution buffer (0.01% SDS, 1.2 mM EDTA, 16.7 mM Tris-HCl, pH 8.1, 1.1% Triton X-100, 167 mM NaCl) was then added to the sonicated samples, followed by centrifugation at 14,000 g for 10 min at 4°C. 150 μl supernatant was collected as input. The remaining supernatant was incubated with 20 μl anti-HA agarose beads (Thermo Fisher Scientific, A2095) for 5 h at 4°C. Agarose beads were pelleted down by centrifugation at 1100 g for 5 min at 4°C. Beads bound to immunocomplexes were then washed with low salt buffer (0.1% SDS, 1% Triton X-100, 2 mM EDTA, 20 mM Tris-HCl, pH 8.1, 150 mM NaCl), high salt wash buffer (0.1% SDS, 1% Triton X-100, 2 mM EDTA, 20 mM Tris-HCl, pH 8.1, 500 mM NaCl), LiCl wash buffer (0.25 M LiCl, 1 mM EDTA, 1% NP-40, 10 mM Tris-HCl, pH 8.1, 1% sodium deoxycholate), and TE buffer (10 mM Tris-HCl, pH 8.1, 1 mM EDTA). Beads were suspended in 250 μl elution buffer (0.1% SDS, 0.5 M NaCl, 25 mM DTT, 1 mM EDTA, 10 mM Tris-HCl, pH 8.1) at RT for 30 min before heating at 65°C overnight for reverse cross-linking. 2.5 μl proteinase K (20 mg/ml), 10 μl 0.5 M EDTA, and 20 μl 1 M Tris-HCl, pH 6.5 were added prior incubating at 55°C for 5 h to release genomic DNA from histones. DNA was then purified and the purified DNA was used for subsequently qPCR analysis. Primers used for TFEB ChIP-qPCR are shown in Table 2.
Table 2.
TFEB ChIP-qPCR primers used in this study.
| Gene | Forward primer (5ʹ-3ʹ) | Reverse primer (5ʹ-3ʹ) |
| ATG5 | CCTCTCCAAGTTCATAGCTT | ATGTACTCTTGGATGGGTGG |
| ATG9A | CCCAATAGTGTGCTCTACGT | CTTCTCGTCTCTCATCCTGC |
| PIK3C3 | AGGCCACTGGAATTTAAACC | GGGAACTTAGGTACAGGAAA |
| BECN1 | GAGGCTCCGCTATTCTCTAA | TCTGAGATGGAGCCTTGCCC |
| LAMP1 | TCCTTTTCCGCGAACCCAGC | GCGTTACCAGACGCAAGAGG |
| LAMP2 | CAATGCAGACAGACATACGC | GCATACTGTGGTACTTCTGT |
| CTSA | ATTGCAACCTCCACCTCTCG | AAGATGCCCTACAAGTTCCC |
| CTSD | CTGCACACAAAACCGCTTCT | AGGAGGGTGGGTAGTGCGAA |
| PASP | GATCCCCCGCAGATATAAAT | CTATGTGAAACCCGCTACTA |
| MCOLN1 | GGAGGATAAGGGGTCAAGCT | CTTCAAACCCTCCGGCATCA |
Quantification of LC3 puncta and autophagic flux
To quantify the number of autophagosomes, the LC3 fluorescent images were first processed by ImageJ (National Institutes of Health) and then analyzed by using MetaMorph (Molecular Devices, Transflour). Usually, cells show low basal level of autophagy under normal culture condition. We thus used computerized software image analysis program (Top Hat algorithm of MetaMorph) to analyze LC3 puncta diameter. In Figure 5, cells displaying more than 30 intense LC3 puncta of 1 to 3 μm were counted as autophagy-positive cells. At least 150 cells were analyzed for each condition. ImageJ software was also used to quantify the intensity ratio of GFP-LC3 to RFP-LC3ΔG. We marked the edges of individual cells and quantified the intensity of GFP and RFP signals in each marked area. At least 150 cells were analyzed for each condition. The images of GFP:RFP ratio were processed by the ImageJ Ratio Plus plugin to display as a pseudo-color imaging.
Quantification of images from western blot
ImageJ was used to quantify the immunoblots. A rectangle was first drawn surrounding the target band and the same setting was applied to all gel bands. Results were expressed as density means ± SD by normalizing to the control group. All the quantifications were obtained from at least three independent experiments.
Cancer proliferation assay
Cells (1x10⁵) were seeded on a 60-mm dish and treated with DMSO or centrinone (250 nM). On the fourth day, cells (1x10⁵) were counted and re-seeded onto a new 60-mm dish. Cells were harvested every two days and the numbers of cells were counted. Results were acquired from three independent experiments.
Cell death analysis
Cells (1x10⁵) were seeded on a 60-mm dish and then treated with DMSO or centrinone for 4 and 8 days. For performing the cell death ELISA, cells were harvested and cell death was measured by Cell death detection ELISA kit (Roche, 11,544,675,001) according to the manufacturer’s instructions.
Centrosome purification
Centrosomes were purified from asynchronous U2OS cells as described [57]. Briefly, cells (1x10⁸) were first treated with 5 μg/ml brefeldin A (Biolegend, 420,601) overnight to detach the centrosomes from Golgi apparatus followed by 200 nM nocodazole treatment at 37°C for 1 h to depolymerize microtubules. Cells were lysed in 20 ml lysis buffer (1 mM HEPES, pH 7.2, 0.5% NP-40, 0.25 mM MgCl2, 0.1% β-mercaptoethanol) with protease inhibitors and homogenized by using a loose-fitting Dounce homogenizer (Wheaton, 357,544). After centrifugation at 1100 g for 10 min at 4°C, the supernatant was filtered through a nylon mesh with 40-μm pore size (SPL LIFE SCIENCES, 93,040). The sample was then treated with 1 μg/ml DNase (BioShop Canada, DRB001) for 30 min before loading on a discontinuous sucrose gradient (3 ml 70%, 3 ml 50%, and 3 ml 40% sucrose [Gibco BRL, 5503 UA] solutions) in a pollyallomer tube (Beckman, 344,058). The sucrose-gradient ultracentrifugation was conducted at 115,000 g for 1 h at 4°C by Beckman centrifuge (Optima XL-I) equipped with a SW28 rotor. Fractions (500 μl/fraction) were collected from the bottom. The aliquots from each fraction were then diluted with 3.5 ml 10 mM HEPES, pH 7.2 and subjected to centrifugation at 75,000 g for 15 min at 4°C via Beckman centrifuge (Optima XL-I) equipped with a SW55 Ti rotor. The collected fractions were then determined by western blot analysis.
Statistical data analysis
All data were represented as mean with SD or SEM from at least three independent experiments. Experiment samples and numbers for statistical testing are reported in the corresponding figure legends. Data distribution was assumed to be normal, but this was not formally tested. All P-values are from Student’s t-tests for two-group comparisons. (GraphPad Prism 7; n.s. not significant, *** P < 0.001, ** P < 0.01, * P < 0.05).
Supplementary Material
Acknowledgments
We thank Meng-Fu Bryan Tsou (Sloan-Kettering Cancer Center), Ruey-Hwa Chen (Institute of Biochemistry, Acadmia Sinca, Taipei, Taiwan), Guang-Chao Chen (Institute of Biochemistry, Acadmia Sinca, Taipei, Taiwan), Zee-Fen Chang (Institute of Molecular Medicine, College of Medicine, National Taiwan University), and Amy Pei-Ching Chang (Institute of Microbiology and Immunology, National Yang Ming Chiao Tung University, Taipei, Taiwan) for sharing reagents and giving us critical comments. We thank Wei-Yi Chen (Institute of Biochemistry and Molecular Biology, National Yang Ming Chiao Tung University, Taipei, Taiwan) for sharing ATG5 KO H1299 cells. We also thank the core facility at Institute of Biochemistry, Academia Sinica for assistance with the SILAC proteomics and Suh-Yuen Liang for data analysis.
Funding Statement
This work was supported by the Ministry of Science and Technology, Taiwan [MOST 110-2628-B-A49A-508]; Ministry of Science and Technology, Taiwan [110-2326-B-A49A-503-MY3]; Far Easstern Memorial Hospital National Yang Ming Chiao Tung University Joint Research Program [111DN02]; Yen Tjing Ling Medical Foundation [CI-108-12].
Disclosure statement
No potential conflict of interest was reported by the author(s).
Supplementary material
Supplemental data for this article can be accessed here
References
- [1].Carvalho-Santos Z, Azimzadeh J, Pereira-Leal JB, et al. Evolution: tracing the origins of centrioles, cilia, and flagella. J Cell Biol. 2011;194:165–175. doi: 10.1083/jcb.201011152. [DOI] [PMC free article] [PubMed] [Google Scholar]
- [2].Hodges ME, Scheumann N, Wickstead B, et al. Reconstructing the evolutionary history of the centriole from protein components. J Cell Sci. 2010;123:1407–1413. doi: 10.1242/jcs.064873. [DOI] [PMC free article] [PubMed] [Google Scholar]
- [3].Azimzadeh J, Bornens M.. Structure and duplication of the centrosome. J Cell Sci. 2007;120:2139–2142. doi: 10.1242/jcs.005231. [DOI] [PubMed] [Google Scholar]
- [4].Zheng Y, Wong ML, Alberts B, et al. Nucleation of microtubule assembly by a gamma-tubulin-containing ring complex. Nature. 1995;378:578–583. doi: 10.1038/378578a0. [DOI] [PubMed] [Google Scholar]
- [5].Pala R, Alomari N, Nauli SM. Primary cilium-dependent signaling mechanisms. Int J Mol Sci. 2017;18:2272. doi: 10.3390/ijms18112272. [DOI] [PMC free article] [PubMed] [Google Scholar]
- [6].Bettencourt-Dias M, Hildebrandt F, Pellman D, et al. Centrosomes and cilia in human disease. Trends Genet. 2011;27:307–315. doi: 10.1016/j.tig.2011.05.004. [DOI] [PMC free article] [PubMed] [Google Scholar]
- [7].Nigg EA, Raff JW. Centrioles, centrosomes, and cilia in health and disease. Cell. 2009;139():663–678. doi: 10.1016/j.cell.2009.10.036. [DOI] [PubMed] [Google Scholar]
- [8].Moyer TC, Holland AJ. PLK4 promotes centriole duplication by phosphorylating STIL to link the procentriole cartwheel to the microtubule wall. eLife. 2019;8 e46054. doi: 10.7554/eLife.46054. [DOI] [PMC free article] [PubMed] [Google Scholar]
- [9].Bahtz R, Seidler J, Arnold M, et al. GCP6 is a substrate of Plk4 and required for centriole duplication. J Cell Sci. 2012;125:486–496. doi: 10.1242/jcs.093930. [DOI] [PubMed] [Google Scholar]
- [10].Kratz AS, Barenz F, Richter KT, et al. Plk4-dependent phosphorylation of STIL is required for centriole duplication. Biol Open. 2015;4:370–377. doi: 10.1242/bio.201411023. [DOI] [PMC free article] [PubMed] [Google Scholar]
- [11].Kim M, Fong CS, Tsou MF. Centriole duplication: when PLK4 meets Ana2/STIL. Curr Biol. 2014;24:R1046–1048. doi: 10.1016/j.cub.2014.09.079. [DOI] [PubMed] [Google Scholar]
- [12].Habedanck R, Stierhof YD, Wilkinson CJ, et al. The Polo kinase Plk4 functions in centriole duplication. Nat Cell Biol. 2005;7:1140–1146. doi: 10.1038/ncb1320. [DOI] [PubMed] [Google Scholar]
- [13].Ohta M, Ashikawa T, Nozaki Y, et al. Direct interaction of Plk4 with STIL ensures formation of a single procentriole per parental centriole. Nat Commun. 2014;5:5267. doi: 10.1038/ncomms6267. [DOI] [PMC free article] [PubMed] [Google Scholar]
- [14].Dzhindzhev NS, Tzolovsky G, Lipinszki Z, et al. Two-step phosphorylation of Ana2 by Plk4 is required for the sequential loading of Ana2 and Sas6 to initiate procentriole formation. Open Biol. 2017;7:170247. doi: 10.1098/rsob.170247. [DOI] [PMC free article] [PubMed] [Google Scholar]
- [15].Firat-Karalar EN, Stearns T. The centriole duplication cycle. Philos Trans R Soc Lond B Biol Sci. 2014;369: 20130460. doi: 10.1098/rstb.2013.0460. [DOI] [PMC free article] [PubMed] [Google Scholar]
- [16].Bazzi H, Anderson KV. Acentriolar mitosis activates a p53-dependent apoptosis pathway in the mouse embryo. Proc Natl Acad Sci U S A. 2014;111:E1491–1500. doi: 10.1073/pnas.1400568111. [DOI] [PMC free article] [PubMed] [Google Scholar]
- [17].Lambrus BG, Daggubati V, Uetake Y, et al. A USP28-53BP1-p53-p21 signaling axis arrests growth after centrosome loss or prolonged mitosis. J Cell Biol. 2016;214(2):143–153. doi: 10.1083/jcb.201604054. [DOI] [PMC free article] [PubMed] [Google Scholar]
- [18].Meitinger F, Anzola JV, Kaulich M, et al. 53BP1 and USP28 mediate p53 activation and G1 arrest after centrosome loss or extended mitotic duration. J Cell Biol. 2016;214:155–166. doi: 10.1083/jcb.201604081. [DOI] [PMC free article] [PubMed] [Google Scholar]
- [19].Fong CS, Mazo G, Das T, et al. 53BP1 and USP28 mediate p53-dependent cell cycle arrest in response to centrosome loss and prolonged mitosis. eLife. 2016;5 e16270. doi: 10.7554/eLife.16270. [DOI] [PMC free article] [PubMed] [Google Scholar]
- [20].Wong YL, Anzola JV, Davis RL, et al. Cell biology. Reversible centriole depletion with an inhibitor of Polo-like kinase 4. Science. 2015;348:1155–1160. doi: 10.1126/science.aaa5111. [DOI] [PMC free article] [PubMed] [Google Scholar]
- [21].Pihan GA, Purohit A, Wallace J, et al. Centrosome defects and genetic instability in malignant tumors. Cancer Res. 1998;58:3974–3985. [PubMed] [Google Scholar]
- [22].Marina M, Saavedra HI. Nek2 and Plk4: prognostic markers, drivers of breast tumorigenesis and drug resistance. Front Biosci (Landmark Ed). 2014;19:352–365. doi: 10.2741/4212. [DOI] [PMC free article] [PubMed] [Google Scholar]
- [23].Shinmura K, Kurabe N, Goto M, et al. PLK4 overexpression and its effect on centrosome regulation and chromosome stability in human gastric cancer. Mol Biol Rep. 2014;41:6635–6644. doi: 10.1007/s11033-014-3546-2. [DOI] [PubMed] [Google Scholar]
- [24].Mizushima N, Levine B. Autophagy in mammalian development and differentiation. Nat Cell Biol. 2010;12:823–830. doi: 10.1038/ncb0910-823. [DOI] [PMC free article] [PubMed] [Google Scholar]
- [25].Russell RC, Yuan HX, Guan KL. Autophagy regulation by nutrient signaling. Cell Res. 2014;24:42–57. doi: 10.1038/cr.2013.166. [DOI] [PMC free article] [PubMed] [Google Scholar]
- [26].Glick D, Barth S, Macleod KF. Autophagy: cellular and molecular mechanisms. J Pathol. 2010;221:3–12. doi: 10.1002/path.2697. [DOI] [PMC free article] [PubMed] [Google Scholar]
- [27].Kroemer G, Marino G, Levine B. Autophagy and the integrated stress response. Mol Cell. 2010;40:280–293. doi: 10.1016/j.molcel.2010.09.023. [DOI] [PMC free article] [PubMed] [Google Scholar]
- [28].Das G, Shravage BV, Baehrecke EH. Regulation and function of autophagy during cell survival and cell death. Cold Spring Harb Perspect Biol. 2012;4:a008813. doi: 10.1101/cshperspect.a008813. [DOI] [PMC free article] [PubMed] [Google Scholar]
- [29].Dikic I, Elazar Z. Mechanism and medical implications of mammalian autophagy. Nat Rev Mol Cell Biol. 2018;19:349–364. doi: 10.1038/s41580-018-0003-4. [DOI] [PubMed] [Google Scholar]
- [30].Yun CW, Lee SH. The roles of autophagy in cancer. Int J Mol Sci. 2018;19:3466. doi: 10.3390/ijms19113466. [DOI] [PMC free article] [PubMed] [Google Scholar]
- [31].Takamura A, Komatsu M, Hara T, et al. Autophagy-deficient mice develop multiple liver tumors. Genes Dev. 2011;25:795–800. doi: 10.1101/gad.2016211. [DOI] [PMC free article] [PubMed] [Google Scholar]
- [32].Mainz L, Rosenfeldt MT. Autophagy and cancer - insights from mouse models. FEBS J. 2018;285:792–808. doi: 10.1111/febs.14274. [DOI] [PubMed] [Google Scholar]
- [33].Sardiello M, Palmieri M, Di Ronza A, et al. A gene network regulating lysosomal biogenesis and function. Science. 2009;325:473–477. doi: 10.1126/science.1174447. [DOI] [PubMed] [Google Scholar]
- [34].Palmieri M, Impey S, Kang H, et al. Characterization of the CLEAR network reveals an integrated control of cellular clearance pathways. Hum Mol Genet. 2011;20:3852–3866. doi: 10.1093/hmg/ddr306. [DOI] [PubMed] [Google Scholar]
- [35].Steingrimsson E, Copeland NG, Jenkins NA . Melanocytes and the microphthalmia transcription factor network. Annu Rev Genet. 2004;38:365–411. doi: 10.1146/annurev.genet.38.072902.092717. [DOI] [PubMed] [Google Scholar]
- [36].Settembre C, Zoncu R, Medina DL, et al. A lysosome-to-nucleus signalling mechanism senses and regulates the lysosome via mTOR and TFEB. EMBO J. 2012;31:1095–1108. doi: 10.1038/emboj.2012.32. [DOI] [PMC free article] [PubMed] [Google Scholar]
- [37].Roczniak-Ferguson A, Petit CS, Froehlich F, et al. The transcription factor TFEB links mTORC1 signaling to transcriptional control of lysosome homeostasis. Sci Signal. 2012;5:ra42. doi: 10.1126/scisignal.2002790. [DOI] [PMC free article] [PubMed] [Google Scholar]
- [38].Napolitano G, Ballabio A. TFEB at a glance. J Cell Sci. 2016;129:2475–2481. doi: 10.1242/jcs.146365. [DOI] [PMC free article] [PubMed] [Google Scholar]
- [39].Vega-rubin-de-celis S, Pena-Llopis S, Konda M, et al. Multistep regulation of TFEB by MTORC1. Autophagy. 2017;13:464–472. doi: 10.1080/15548627.2016.1271514. [DOI] [PMC free article] [PubMed] [Google Scholar]
- [40].Li Y, Xu M, Ding X, et al. Protein kinase C controls lysosome biogenesis independently of mTORC1. Nat Cell Biol. 2016;18:1065–1077. doi: 10.1038/ncb3407. [DOI] [PubMed] [Google Scholar]
- [41].Suri A, Bailey AW, Tavares MT, et al. Evaluation of protein kinase inhibitors with PLK4 cross-over potential in a pre-clinical model of cancer. Int J Mol Sci. 2019;20:2112. doi: 10.3390/ijms20092112. [DOI] [PMC free article] [PubMed] [Google Scholar]
- [42].Arquint C, Nigg EA. STIL microcephaly mutations interfere with APC/C-mediated degradation and cause centriole amplification. Curr Biol. 2014;24:351–360. doi: 10.1016/j.cub.2013.12.016. [DOI] [PubMed] [Google Scholar]
- [43].Strnad P, Leidel S, Vinogradova T, et al. Regulated HsSAS-6 levels ensure formation of a single procentriole per centriole during the centrosome duplication cycle. Dev Cell. 2007;13:203–213. doi: 10.1016/j.devcel.2007.07.004. [DOI] [PMC free article] [PubMed] [Google Scholar]
- [44].Kim M, O’Rourke B, Soni R, et al. Promotion and suppression of centriole duplication are catalytically coupled through PLK4 to ensure centriole homeostasis. Cell Rep. 2016;16:1195–1203. doi: 10.1016/j.celrep.2016.06.069. [DOI] [PMC free article] [PubMed] [Google Scholar]
- [45].Wang WJ, Acehan D, Kao C-H, et al. centriole formation in human cells is error-prone and does not require SAS-6 self-assembly. eLife. 2015;4:e10586. doi: 10.7554/eLife.10586. [DOI] [PMC free article] [PubMed] [Google Scholar]
- [46].Ong SE, Blagoev B, Kratchmarova I, et al. Stable isotope labeling by amino acids in cell culture, SILAC, as a simple and accurate approach to expression proteomics. Mol Cell Proteomics. 2002;1:376–386. doi: 10.1074/mcp.m200025-mcp200. [DOI] [PubMed] [Google Scholar]
- [47].Kaizuka T, Morishita H, Hama Y, et al. An autophagic flux probe that releases an internal control. Mol Cell. 2016;64:835–849. doi: 10.1016/j.molcel.2016.09.037. [DOI] [PubMed] [Google Scholar]
- [48].Settembre C, Di Malta C, Polito VA, et al. TFEB links autophagy to lysosomal biogenesis. Science. 2011;332:1429–1433. doi: 10.1126/science.1204592. [DOI] [PMC free article] [PubMed] [Google Scholar]
- [49].Palmieri M, Pal R, Nelvagal HR, et al. mTORC1-independent TFEB activation via Akt inhibition promotes cellular clearance in neurodegenerative storage diseases. Nat Commun. 2017;8:14338. doi: 10.1038/ncomms14338. [DOI] [PMC free article] [PubMed] [Google Scholar]
- [50].Godinho SA, Pellman D. Causes and consequences of centrosome abnormalities in cancer. Philos Trans R Soc Lond B Biol Sci. 2014;369:20130467. doi: 10.1098/rstb.2013.0467. [DOI] [PMC free article] [PubMed] [Google Scholar]
- [51].Rivera-Rivera Y, Saavedra HI. Centrosome - a promising anti-cancer target. Biologics. 2016;10:167–176. doi: 10.2147/BTT.S87396. [DOI] [PMC free article] [PubMed] [Google Scholar]
- [52].Mason JM, Lin D-C, Wei X, et al. Functional characterization of CFI-400945, a Polo-like kinase 4 inhibitor, as a potential anticancer agent. Cancer Cell. 2014;26:163–176. doi: 10.1016/j.ccr.2014.05.006. [DOI] [PubMed] [Google Scholar]
- [53].Meitinger F, Ohta M, Lee K-Y, et al. TRIM37 controls cancer-specific vulnerability to PLK4 inhibition. Nature. 2020;585:440–446. doi: 10.1038/s41586-020-2710-1. [DOI] [PMC free article] [PubMed] [Google Scholar]
- [54].Yeow ZY, Lambrus BG, Marlow R, et al. Targeting TRIM37-driven centrosome dysfunction in 17q23-amplified breast cancer. Nature. 2020;585:447–452. doi: 10.1038/s41586-020-2690-1. [DOI] [PMC free article] [PubMed] [Google Scholar]
- [55].Martina JA, Chen Y, Gucek M, et al. MTORC1 functions as a transcriptional regulator of autophagy by preventing nuclear transport of TFEB. Autophagy. 2012;8:903–914. doi: 10.4161/auto.19653. [DOI] [PMC free article] [PubMed] [Google Scholar]
- [56].Mali P, Yang L, Esvelt KM, et al. RNA-guided human genome engineering via Cas9. Science. 2013;339:823–826. doi: 10.1126/science.1232033. [DOI] [PMC free article] [PubMed] [Google Scholar]
- [57].Gogendeau D, Guichard P, Tassin AM. Purification of centrosomes from mammalian cell lines. Methods Cell Biol. 2015;129:171–189. doi: 10.1016/bs.mcb.2015.03.004. [DOI] [PubMed] [Google Scholar]
Associated Data
This section collects any data citations, data availability statements, or supplementary materials included in this article.