
Figure 1.
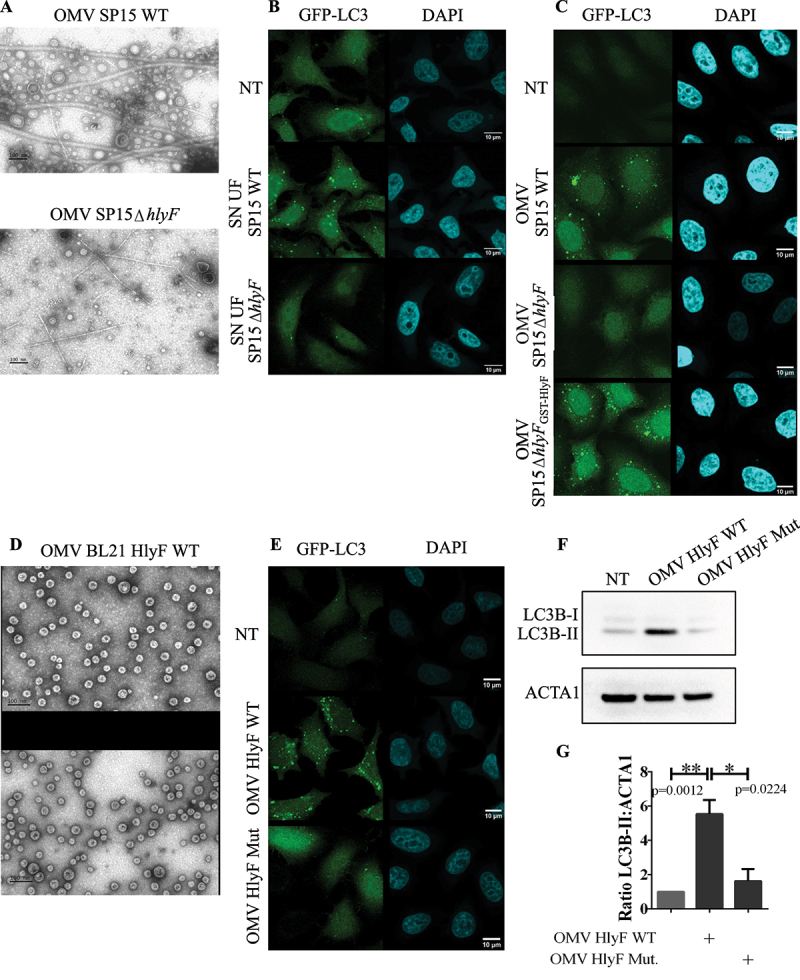
Increased LC3-positive structure number in epithelial cells treated by OMVs from E. coli producing HlyF. (A) Images of purified OMVs with equivalent volumes from wild-type SP15 (SP15 WT) and from SP15ΔhlyF visualized by negative staining transmission electron microscopy (TEM). Scale bar: 100 nm. Images representative of 3 independent experiments. (B-C) Images of confocal microscopy of GFP-LC3 (green) and DAPI (blue) in GFP-LC3-HeLa cells treated 3 h with supernatant from wild-type SP15 (SP15 WT) and SP15ΔhlyF 250 µL/mL after ultrafiltration (B) or with purified OMVs with equivalent protein dosage from wild-type SP15 (SP15 WT) 10 µg/mL, SP15ΔhlyF 10 µg/mL and SP15ΔhlyFGST-HlyF 1 µg/mL (C). Scale bar: 10 µm. Images representative of 3 independent experiments. (D) Images of purified OMVs with equivalent protein dosage from BL21 expressing HlyF WT or inactivated (Mut) visualized by negative staining TEM. Scale bar: 100 nm. Images representative of 3 independent experiments. (E) Images of confocal microscopy of GFP-LC3 (green) and DAPI (blue) in GFP-LC3-HeLa cells treated 3 h with OMV BL21 HlyF WT or OMV BL21 HlyF Mut 5 µg/mL. Scale bar: 10 µm. Images representative of 3 independent experiments. (F) Western blot analysis of LC3 and ACTA1 in cell extracts of HeLa cells treated 3 h with OMVs from BL21 HlyF WT and BL21 HlyF Mut 5 µg/mL. Experiment reproduced 3 times independently. (G) Quantification of the LC3B-II:ACTA1 ratios of the Figure 1F obtained by densitometric analysis of 3 independent experiments. The graph shows the mean and the standard deviation for each condition. ** p < 0,01 and *p < 0,05t test.