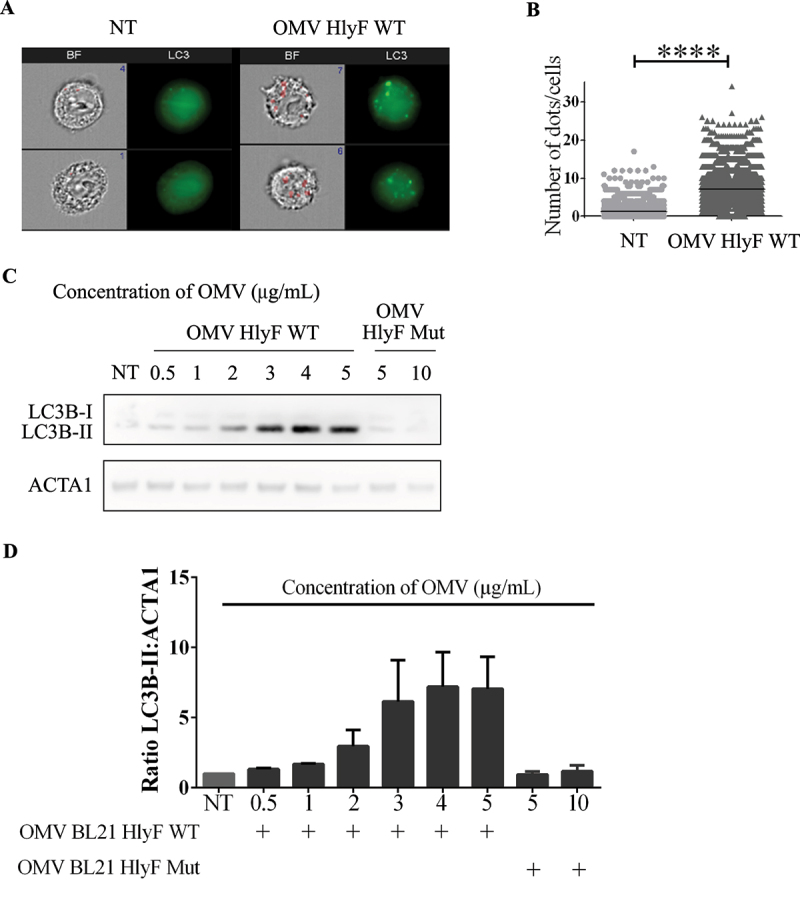
Figure 2.

OMVs-induced increase of LC3-positive structure number wasdose-dependent. (A) Images acquired by ISX of GFP-LC3 HeLa cells treated 3 h with OMVs from BL21 HlyF WT 5 µg/mL. On the left panel, brightfield channel (BF) images the cells according to their size and morphology; on the right panel, LC3 channel images cells according to their fluorescence in GFP-LC3 in green. Number of LC3 green dots of GFP-LC3 per cell is indicated in blue in the dial at the top right of the BF channel. The mask is shown in red on the BF. Scale bars: 7 µm. Images representative of 4 independent experiments. (B) Quantification of (A). Number of LC3 green dots of GFP-LC3 per cell counted with the Spot count function is indicated on the vertical axis on a minimum of 3000 cells per condition. Each square represents a cell image acquired by ISX. The graphs show the mean for each condition. ****p < 0.0001 t test. Graph representative of 4 independent experiments. (C) HeLa cells were treated with increasing concentrations of OMVs from BL21 HlyF WT for 3 h then LC3 and ACTA1 were analyzed by western blot. Experiment reproduced 3 times independently. (D) Quantification of the LC3B-II:ACTA1 ratios of the Figure 2C obtained by densitometric analysis of 3 independent experiments. The graph shows the mean and the standard deviation for each condition.
