Figure 3.

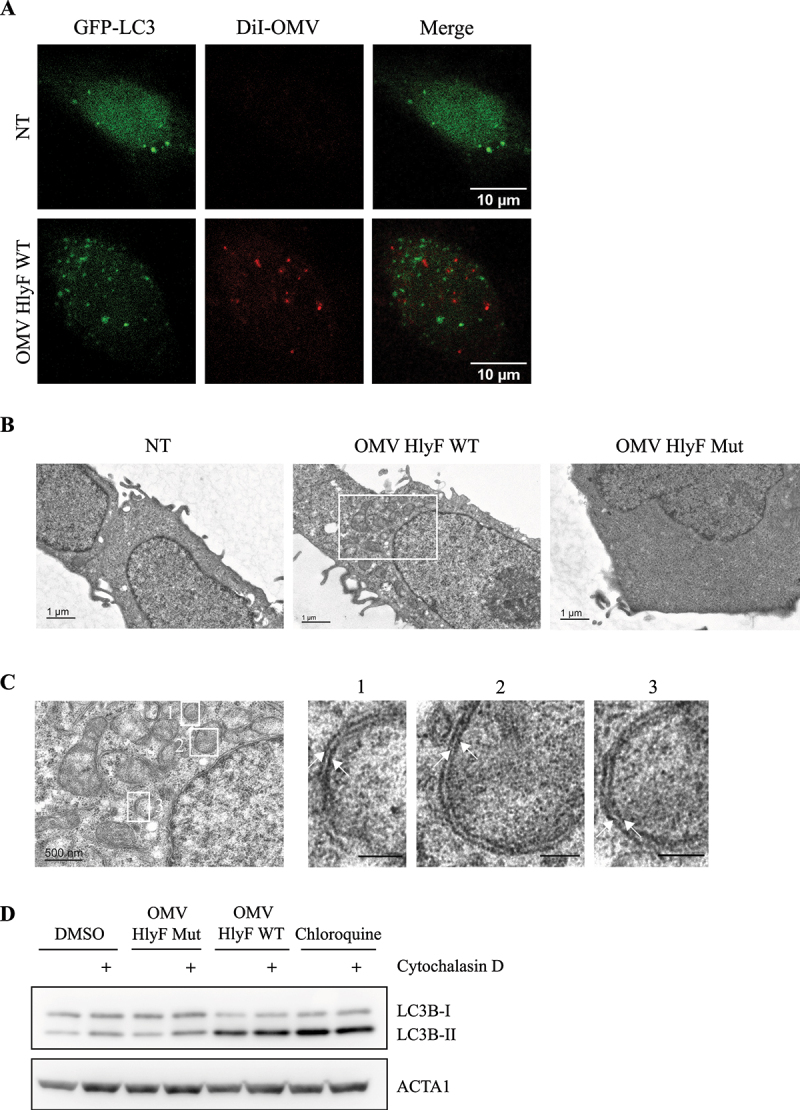
OMVs HlyF WT triggered the specific accumulation of autophagosomes in host cells. (A) Confocal images of GFP-LC3 (green) and fluorescently labeled OMVs with DiI (Red) fluorescence in GFP-LC3 HeLa cells. The cells were incubated with OMVs from BL21 HlyF WT 5 µg/mL for 3 h. 100 cells were analyzed per condition. Scale bar: 10 µm. Images representative of 3 independent experiments. (B-C) Ultrastructure of HeLa cells visualized by TEM. The cells were incubated with OMVs from BL21 HlyF WT or from BL21 HlyF Mut 5 µg/mL for 3 h. 15 cells were analyzed per condition. (B) Scale bar: 1 µm. (C) The image is a magnification of the part of the image (B) within the rectangle. Scale bar: 500 nm. The images on the right panel are a magnification of the part of the image of the left panel within the rectangles 1, 2 and 3. Arrows indicate double-membrane of autophagosomes. (D) HeLa cells incubated with DMSO or 5 µM cytochalasin D were left untreated or treated with 5 µg/mL of OMVs from BL21 HlyF WT, from BL21 HlyF Mut or 50 μM chloroquine for 3 h before LC3 and ACTA1 western-blot analysis.
