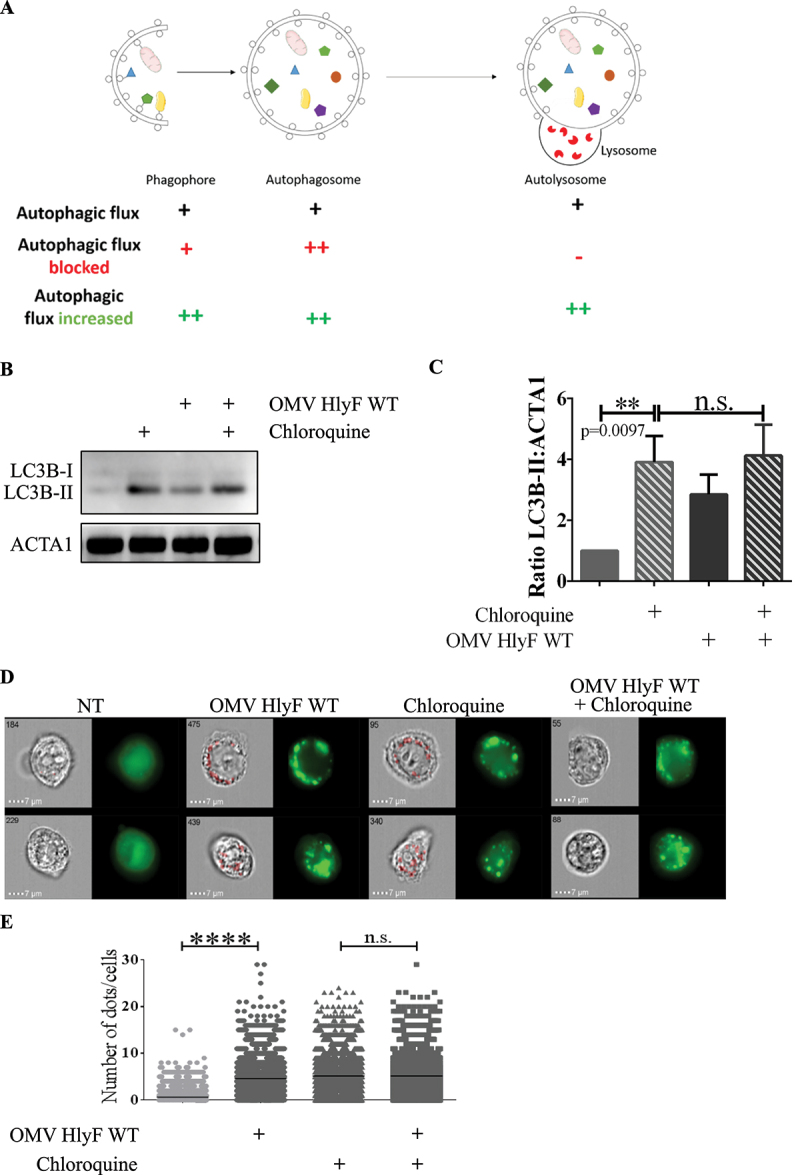
Figure 4.

Autophagy flux was blocked by OMVs HlyF WT. (A) Schema of the autophagic flux and of the accumulation of different autophagic structures depending on the autophagic dynamic regulation (adapted from Mizushima et al., 2010). (B) HeLa cells were treated with OMVs from BL21 HlyF WT 5 µg/mL and/or 50 μM chloroquine for 3 h before LC3 and ACTA1 western-blot analysis. Experiment reproduced 3 times independently. (C) Quantification of the LC3B-II:ACTA1 ratios of the Figure 4B obtained by densitometric analysis of 3 independent experiments. The graph shows the mean and the standard deviation for each condition. **p: 0.0097 t test, n.s.: non-significant. (D) GFP-LC3 HeLa cells were treated with OMVs from BL21 HlyF WT 5 µg/mL and/or 50 μM chloroquine for 3 h before ISX analysis. On the left panel, brightfield channel (BF) images; on the right panel, LC3 channel image cells according to their fluorescence in GFP-LC3 in green. Scale bars: 7 µm. Images representative of 3 independent experiments. (E) Quantification of (D). Number of LC3 green dots of GFP-LC3 per cell counted with the Spot count function is indicated on the vertical axis, on a minimum of 3000 cells per condition. Each square represents a cell image acquired by ISX. The graphs show the mean for each condition. Experiment reproduced 3 times independently, ****p < 0.0001 t test.
