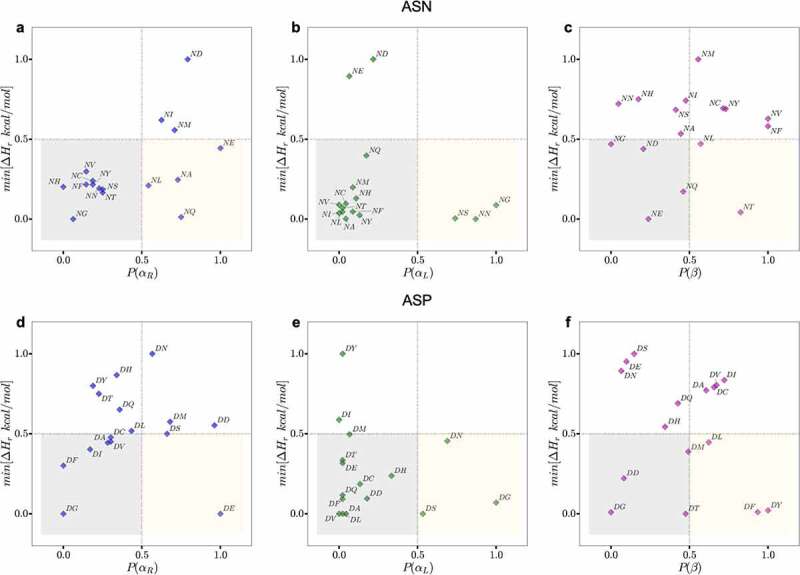
Figure 4.

Plots of the normalized probability of secondary structure conformations for NX (upper panels) or DX (lower panels) motifs for antibody structures in PDB (X-axis) and the normalized minimum PM6 proton affinity heat of formation observed in the same region in Y-axis. The yellow boxes show motifs that are likely to adapt the corresponding conformation (X-axis) resulting in a low relative proton affinity. The gray boxes highlight motifs that are less likely to adapt the corresponding conformation but will result in a low proton affinity. The regions outside gray and yellow represent high proton affinity motifs and conformations (less prone to degradation). The residues in the yellow boxes are most often the hot spot residues.
