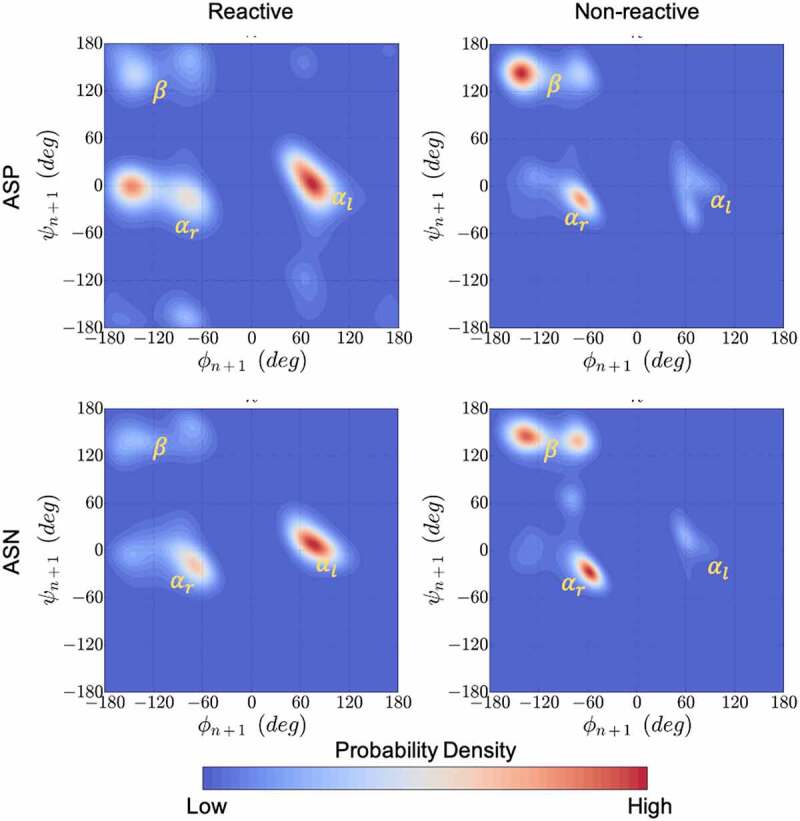
Figure 5.

Kernel density estimation plots for the ϕ & ψ dihedral angles populated in MD simulations combined for all 1039 residues that neighbor Asp (top) or Asn (bottom) in the Adimab dataset. The ϕ & ψ angle distributions were collected from μs long equilibrium MD simulations and classified as reactive (left) and non-reactive (right) based on the measurements reported in the Adimab dataset. A clear pattern emerges around the left-handed α-helix conformation in reactive cases that is distinct from the non-reactive cases on the right.
