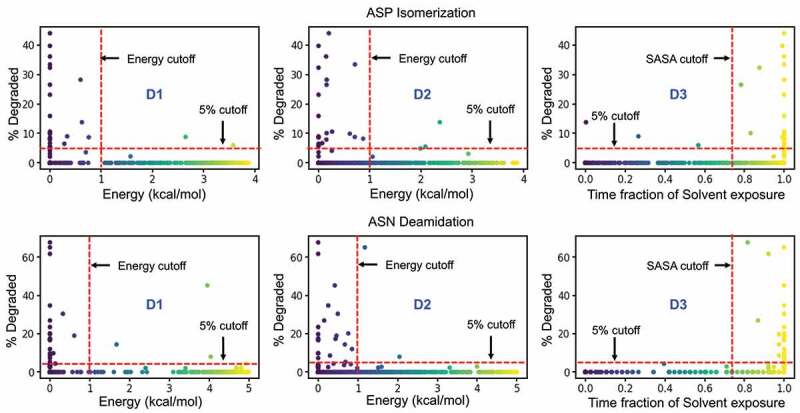
Figure 7.

Performance of individual descriptors in discriminating degraded Asp (top) and Asn (bottom) residues from the Adimab dataset. The percentage degradation values reported in the Adimab study are represented on the X-axis. The Y-axis in the leftmost panel (D1) is the free-energy barrier at the deprotonation prone backbone helical conformation of the n + 1 residue. The Y-axis in the middle panel (D2) is the free-energy barrier at the near-attack conformation defined by the ψ & χ angles. The Y-axis in the rightmost panel (D3) is the time fraction when the Asp/Asn residue remains solvent accessible. The red cutoff markers indicate the values that determine if a residue is prone to degradation or not. The blue shaded regions indicate the false negative predictions (experimentally observed to degrade but classified as non-reactive) and the gray shaded region indicates the false positives (predicted reactive but not evidenced experimentally).
