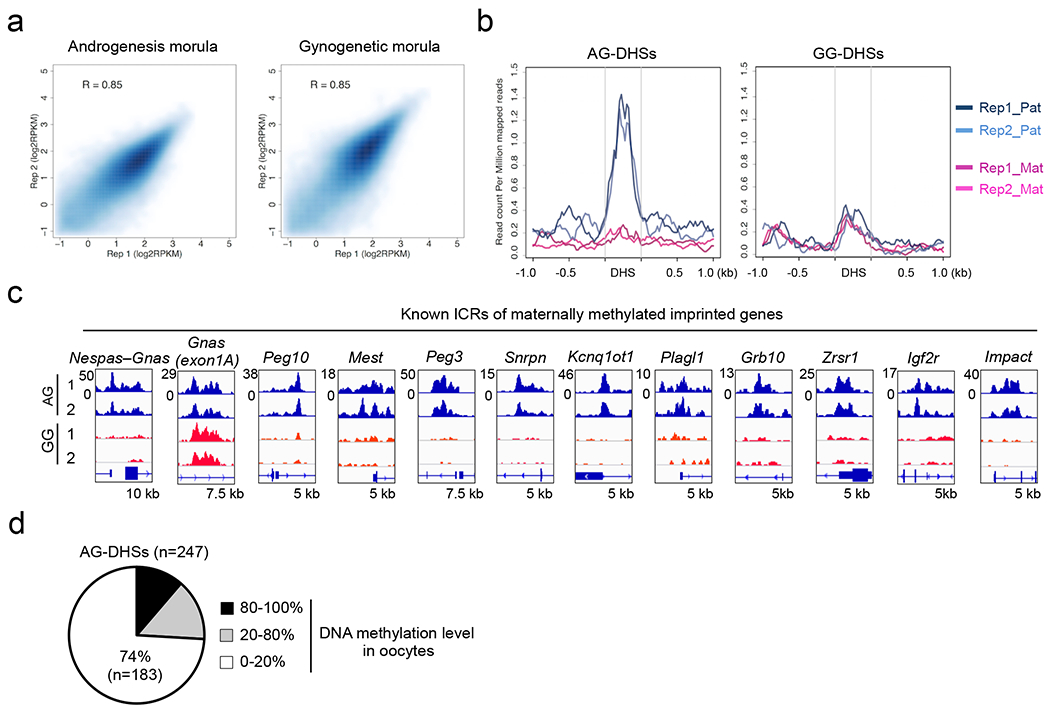
Extended data figure 5. Androgenetic (AG)- and gynogenetic (GG)-specific DHSs in morula embryos, related to Figure 3.

a, Scatter plot showing the correlation between biological duplicates of liDNase-seq for AG and GG morula embryos.
b, Averaged SNP-tracked liDNase-seq signal intensity of paternal and maternal alleles in hybrid morula embryos. The data were obtained from morula embryos of a BDF1 and JF1 cross 7. Plots from the biological duplicates (e.g. BDF1_1 and BDF1_2) are shown. Note that paternal (JF1), but not maternal (BDF1), SNP reads are enriched in AG-DHSs (left panel), while neither SNP reads are enriched in GG-DHSs (right panel).
c, Genome browser view of DHSs at known imprinting control regions (ICRs). The genomic locations of ICRs were defined previously 9.
d, Pie chart showing AG-DHSs grouped based on their oocyte DNA methylation levels.
