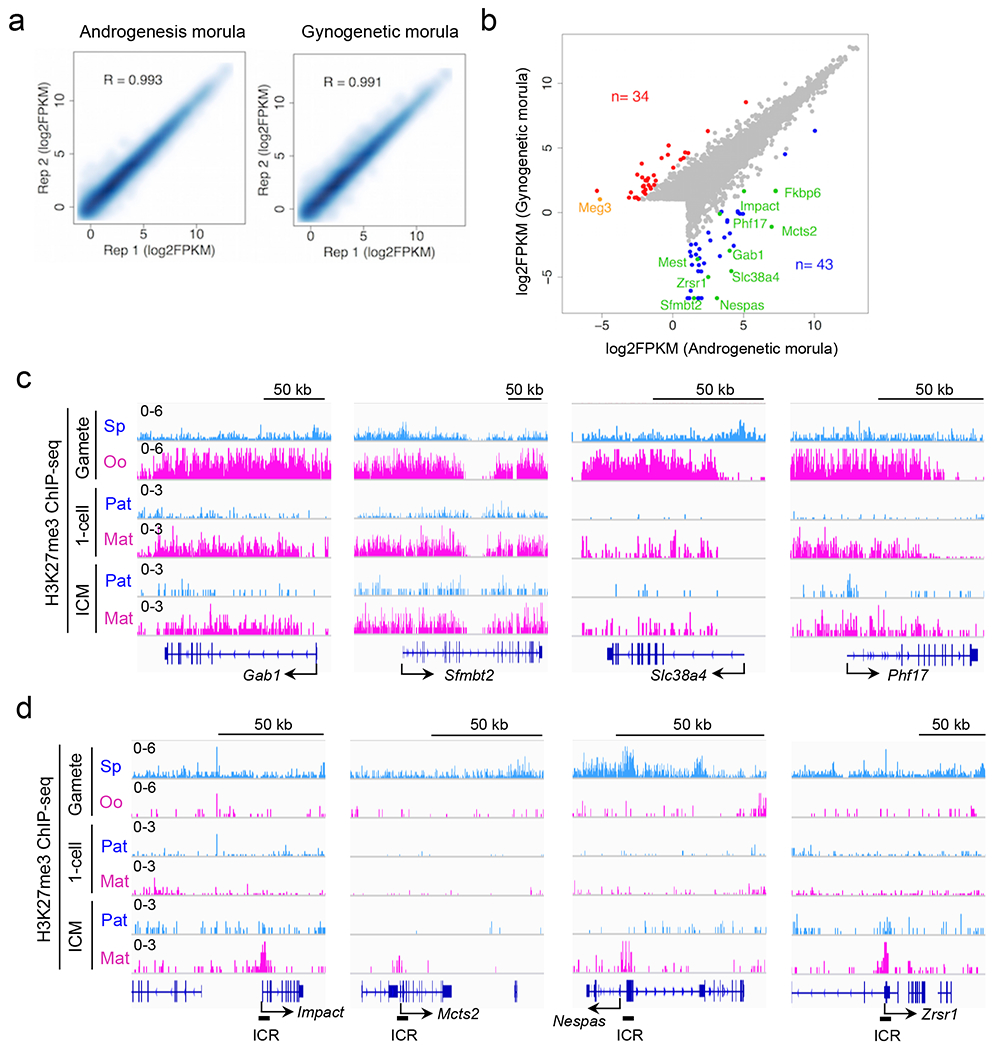
Extended data figure 6. Allelic gene expression in morula embryos, related to Figure 3.

a, Scatter plot showing the correlation between biological duplicates of RNA-seq samples.
b, Scatterplot of gene expression levels in AG- and GG morula embryos. AG- and GG-specific differentially expressed genes (DEGs) (FC>10) are indicated in blue and red, respectively. Paternally- and maternally-expressed known imprinted genes are indicated in green and orange, respectively.
c, Genome browser views of allelic H3K27me3 levels in non-canonical imprinted genes. Sp; sperm. Oo; MII-stage oocyte. ICM; inner cell mass of blastocysts. Paternal (Pat) and maternal (Mat) allele signals in 1-cell and ICM were based on SNP analyses.
d, Genome browser views of allelic H3K27me3 levels in representative canonical imprinted genes. Known ICRs are indicated at the bottom of each canonical imprinted gene.
