
Extended data figure 2. Experimental scheme, RNA-seq reproducibility and analysis scheme, related to Figure 1.
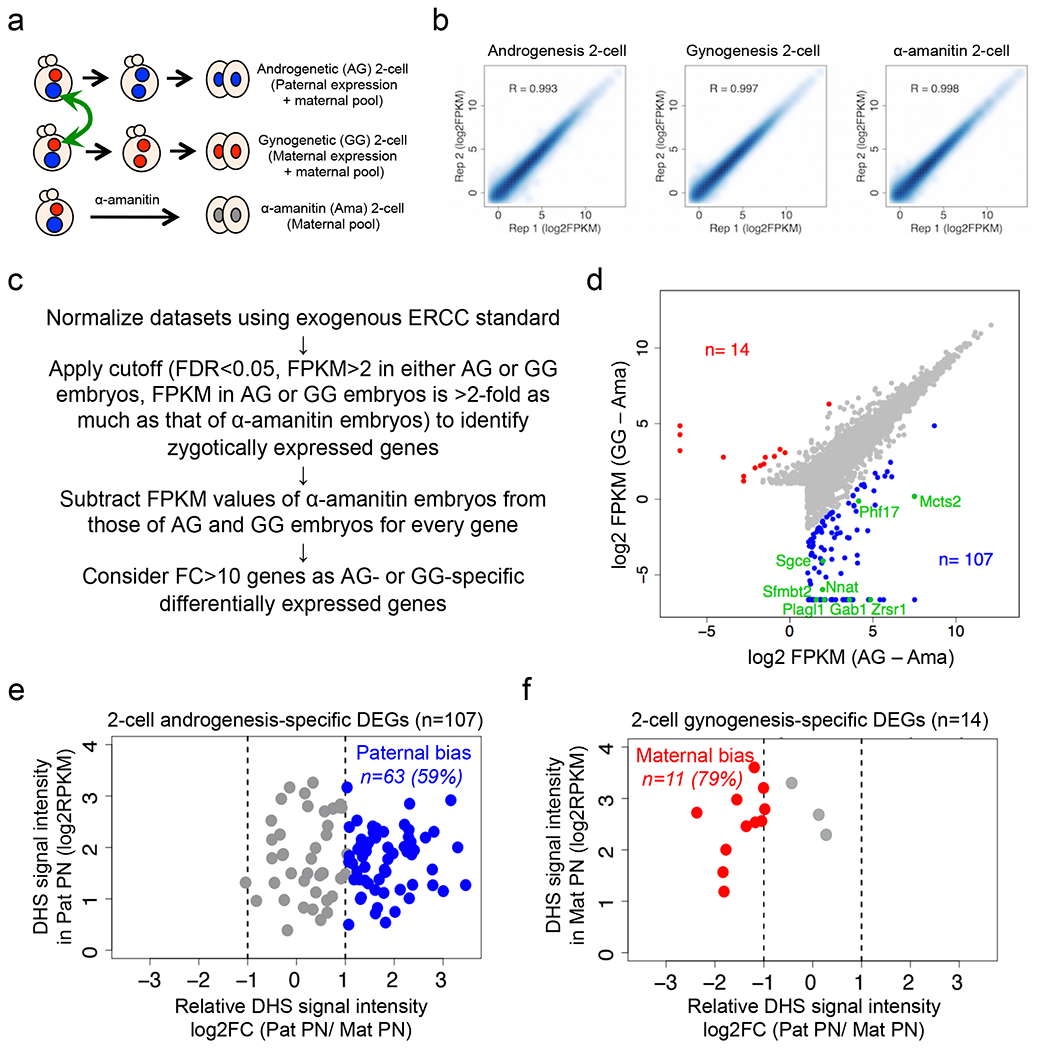
a, Schematic for identifying parental allele-specific gene expression at ZGA. Androgenetic (AG) embryos and gynogenetic (GG) embryos were produced by pronuclear transfer. AG 2-cell embryos contain paternally-expressed nascent transcripts and maternally-stored transcripts. GG 2-cell embryos contain maternally-expressed nascent transcripts and maternally-stored transcripts. α-amanitin-treated (Ama) 2-cell embryos contain maternally-stored transcripts only.
b, Scatter plot showing the correlation between biological duplicate of 2-cell RNA-seq samples.
c, Flowchart for avoiding maternally-stored transcripts and identifying nascent allelic transcripts at ZGA.
d, Scatterplot of nascent transcripts in AG and GG 2-cell embryos. For each gene, the FPKM value in Ama embryos was subtracted from that in AG and GG embryos, respectively. AG- and GG-specific differentially expressed genes (DEGs) (FC>10) are indicated in blue and red, respectively. Known imprinted genes are indicated in green.
e, f, Scatterplot showing DHS allelic bias at promoters (±0.5 kb at TSS) of androgenesis- (e) and gynogenesis- (f) specific differentially expressed genes (DEGs). FC>2 was considered as ‘bias’ (blue or red).